Monthly Cotton Economic Letter (2017.09)
Oct 31, 2017 | by Flora
Recent price movement
NY futures and the A Index were influenced by U.S. crop expectations over the past month. Chinese prices were affected by exchange rates. South Asian prices were flat or lower.
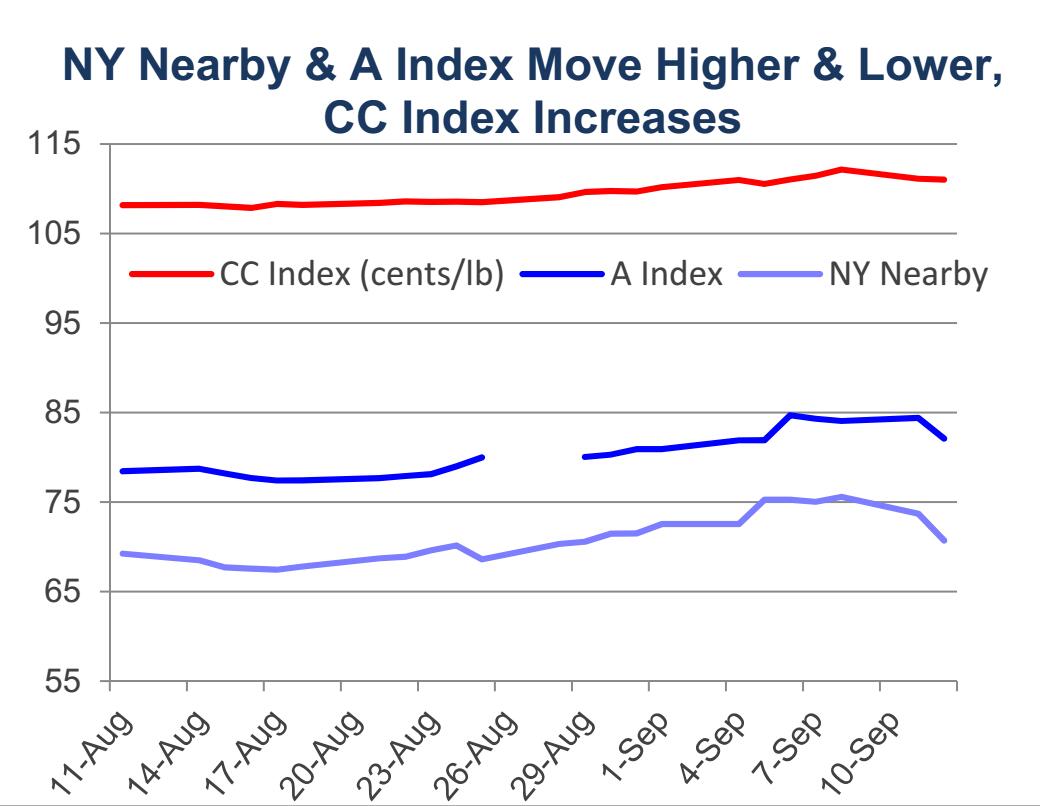
・ After collapsing with the release of a higher U.S. production forecast in last month’s report, NY futures moved higher with production-related concerns stemming from the arrival of two major hurricanes. Values climbed from levels near 67 cents/lb in mid-August to those near 75 cents/lb in early September. Since it became apparent that hurricane Irma’s damage may be less than initially feared, NY futures turned lower. This month’s USDA report, which featured another large increase to the U.S. production forecast, sent values down further, with the market locking down the three cents/lb limit the day the report was released. .
・ Cotlook’s A Index followed the pattern of movement in NY futures, rising from levels near 77 cents/lb to those near 84 cents/lb between mid-August and early September. More recently, the direction turned lower, with the latest value for the A Index being 82 cents/lb.
・ The China Cotton (CC) Index was stable in domestic terms, holding to levels near 15,900 RMB/ton. However, with the RMB strengthening about 4% against the dollar over the past month, the value of the CC Index in terms of USD rose about 4%. This lifted the CC Index in dollar terms from levels near 108 cents/lb to those near 112 cents/lb.
・ Cash prices for the Indian Shankar-6 variety were mostly flat over the past month. In international terms, values held to levels near 85 cents/lb. In domestic terms, values traded near 42,200 INR/candy.
・ Pakistani prices decreased slightly in both international and domestic terms over the past month. In international terms, Pakistani spot rates fell from values near 75 cents/lb to those near 70 cents/lb. In domestic terms, prices rose from 6,450 to 6,100 PKR/maund.
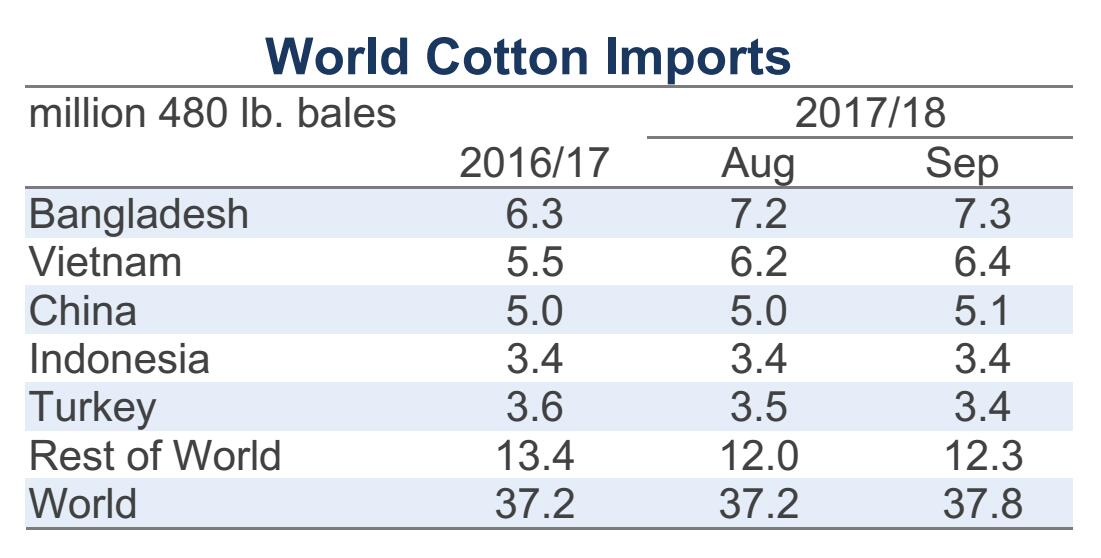
Supply, demand, & trade
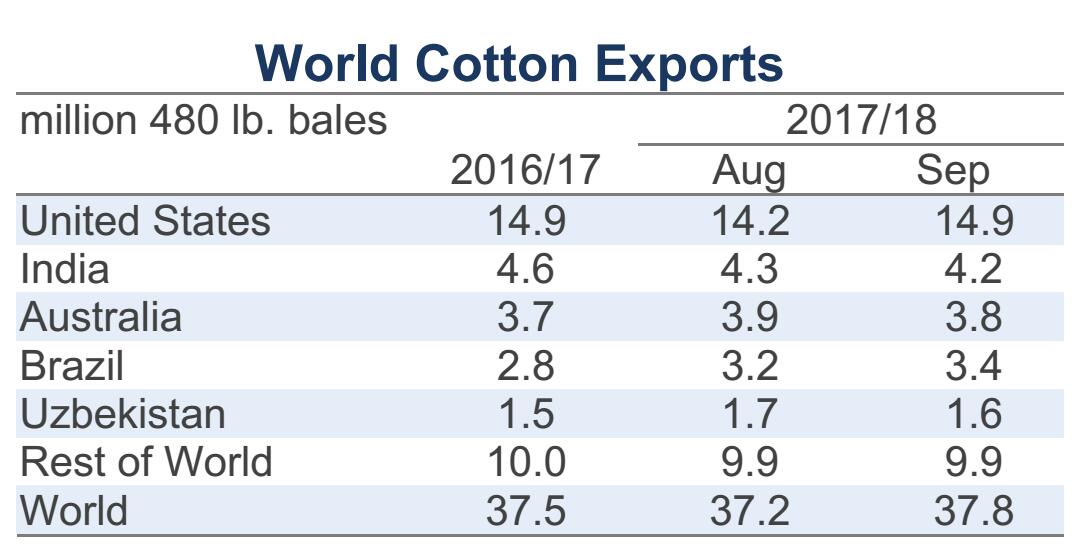
For the second straight month, the USDA report was dominated by a large upward revision to the U.S. production figure. Despite the arrival of two major hurricanes in recent weeks, this month’s update was a 1.2 million bale increase. The current projection of 21.8 million bales suggests the largest crop since 2006/06 and will rank 2017/18 as the third largest U.S. harvest on record (behind only 2004/05 and 2005/06, when production was 23.3 and 23.9 million bales).
Due to recent storms, the USDA’s estimate of abandoned acres increased (planted acres not harvested due to crop conditions). However, upward revisions to estimates for planted acreage (+560,000 acres, to 12.6 million) and yield far outweighed the negative influence on production. The national yield for upland cotton is forecast to set a new record this crop year (908 lb/harvested acres, up 16 lb/acre versus last month, up 41 lb/acre versus 2016/17, and up 34 lb/acre versus the previous record from 2012/13).
The larger U.S. crop implies more cotton will be available for sale from the world’s largest exporting country, and the forecast for U.S. exports increased 700,000 bales to 14.9 million. The current forecast for 2017/18 is essentially equal to the figure for 2016/17, which ranked as the second highest on record (only behind 2005/06, when U.S. exports were 17.7 million bales). The U.S. mill-use figure was flat relative to last month, so the bigger increase in supply relative to demand resulted in an increase to ending stocks (+200,000 bales, from 5.8 to 6.0 million bales). This increase is not as large as the 500,000 difference between the increase in production (1.2 million) and the increase in exports (700,000) because the USDA put 300,000 bales into their unaccounted category. This was likely done to leave room for later revisions, which could include the addition of this volume to ending stocks.
Outside of the U.S., there were several other notable upward revisions to production forecasts. Indian production was increased 1.0 million bales (from 29.0 to 30.0 million bales). Brazilian production was increased 500,000 bales (from 7.0 to 7.5 million). Mexican production was increased 230,000 bales (from 1.2 to 1.4 million). Australian production was increased 200,000 bales (from 4.8 to 5.0 million). Turkish production was increased 200,000 bales (from 3.6 to 3.8 million). There were no significant decreases to country-level production forecasts, and the global harvest estimate for 2017/18 rose 3.4 million bales (from 117.3 to 120.8 million). If realized, this represents the largest world harvest since 2012/13 and ranks as the fifth largest on record.
Meanwhile, the global mill-use figure was mostly unchanged at 117.5 million bales (+334,000 bales). At the country-level, the only notable revisions were for Brazil (+100,000, from 3.3 to 3.4 million) and Turkey (+100,000, from 6.6 to 6.7 million).
One consequence of the large increase in global harvest expectations relative to mill-use is that it shifted the world’s supply and demand relationship in the 2017/18 crop year from being one of relatively equal production and consumption to one of surplus production. Another consequence of the large increase in harvest expectations relative to mill-use is that global ending stocks are expected to rise even further (+2.4 million bales, from 90.1 to 92.5 million). An important additional point is that there were no major changes to Chinese figures, so all of the increase in stocks is projected to occur outside of China. This is relevant because the cotton in storage outside of China is available for trade and therefore is available to weigh on prices.
The current forecast for stocks for the world-less-China is 53.1 million bales. This is nearly 30% higher than the 41.2 million bales in storage at the end of the 2016/17 season (41.2 million) and nearly 20% higher than the previous record of 44.8 million set in the 2014/15 crop year (44.8 million). The stocks-to-use ratio for the world-less-China is now projected to exceed the previous record by more than ten percentage points (62.9% in 2017/18, 52.3% in 2014/15).
Price outlook
This month’s revisions changed the storyline for the 2017/18 crop year from being on relatively equal production and consumption to one of production surplus. While the two recent hurricanes highlight uncertainty that surrounds production forecasts until bales are harvested, ginned, and safely moved out of harm’s way, this month’s set of revisions highlights an old saying in the cotton market, and that is that big crops tend to get bigger. It remains to be seen what the full extent of storm-related damage might be, but the latest crop condition ratings are strong and yield prospects are favorable. This is true outside the U.S. as well. While late rains have affected planting and harvesting in India, there is also the potential for upward crop adjustments for that country. With mill-use forecasts already suggesting a relatively strong 4% increase in consumption there may be limited opportunity for increases on the demand side of the balance sheet. This suggests further increases in cotton production figures should imply further increases in stocks, and therefore further downward pressure on prices.