Monthly Cotton Economic Letter (2017.08)
Sep 19, 2017 | by Flora
Recent price movement
Most benchmark cotton prices moved higher over the past month, with exchange rates contributing to increases in Asian prices quoted in USD.

・ Values for the NY December futures contract moved higher from mid-July through early August, climbing from levels near 67 cents/lb to those just above the 71 cent/lb level in early August. With the release of this month’s USDA report, however, futures turned lower with values dropping nearly the 3 cents/lb limit and closing near 68 cents/lb.
・ Cotlook’s A Index decreased five cents/lb over the past month, but that decrease was driven by the change in price definition with the onset of the new crop year. In the months leading up to the onset of the 2017/18 crop year, Cotlook published both the A Index, which referenced prices for near-term delivery from 2016/17 supplies, and the Forward A Index, which referenced prices for shipments from 2017/18 supply. With the new crop year starting on August 1st, the Forward A Index became the standard A Index. With near-term supplies tight and expectations for a significant increase in supply in 2017/18, the transition resulted in the decline in A Index values.
・ The China Cotton (CC) Index increased slightly in international terms over the past month, rising from 106 to 108 cents/lb. In domestic terms, prices were mostly stable near 15,900 RMB/ton, indicating the change in the CC Index in U.S. dollar terms was driven by exchange rates. The USD fell 1.5% against the RMB over the past month.
・ Although there was a slight decrease in second half of July, cash prices for the Indian Shankar-6 variety were mostly flat over the past month. In international terms, values held to levels near 85 cents/lb. In domestic terms, values decreased slightly, from 43,300 INR/candy to 42,400 INR/candy. Exchange rates were a factor, with the USD also falling against the INR over the past month.
・ Pakistani prices increased in both international and domestic terms over the past month. In international terms, Pakistani spot rates rose from values just below 70 cents/lb to those near 75 cents/lb. In domestic terms, prices rose from 6,100 to 6,450 PKR/maund.
Supply, demand, & trade
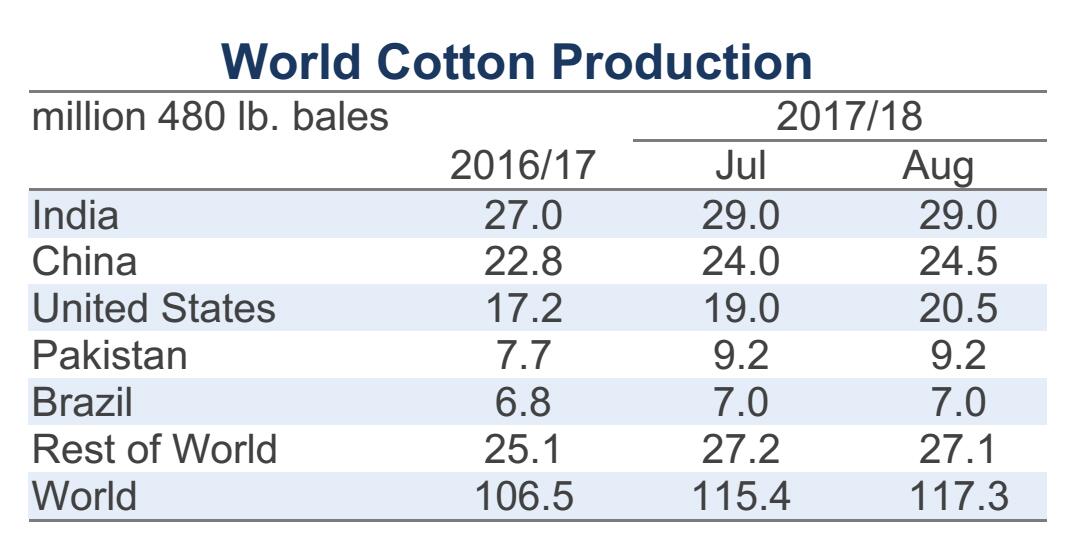
In August, the source for the USDA’s U.S. production estimates shifts from being analyst-based (May-July) to those being based on field observations collected through surveys (August-afterwards). Due to the shift in methodology, there can be large changes in U.S. production figures between July and August. Due to a more optimistic yield forecast, this month’s report featured a large increase to the U.S. production number, with the projection rising 1.5 million bales, from 19.0 to 20.5 million. If realized, this would be the first crop year since 2006/07 that the U.S. produced more than 20 million bales. Even with a large upward revision to the 2017/18 forecast for U.S. exports (+700,000 bales, from 13.5 to 14.2 million), the addition to production caused the estimate for U.S. ending stocks to climb significantly higher (+500,000, from 5.3 to 5.8 million). The current projection indicates that U.S. stocks at the end of 2017/18 will swell to more than twice the volume in storage at the end of 2016/17 (2.8 million bales in 2016/17, 5.8 million in 2017/18).
The general pattern of revisions made to U.S. figures were echoed in changes to global estimates, with important increases to forecasts for world production and ending stocks. The global production number was increased 1.9 million bales (from 115.4 to 117.3 million). If realized, this would be the largest world harvest since 2014/15. Notable non-U.S. changes to 2017/18 production figures were made for China (+500,000, from 24.0 to 24.5 million) and Turkey (-200,000, from 3.8 to 3.6 million).
The global mill-use forecast was mostly unchanged (+375,000 bales, from 117.0 to 117.4 million). Notable revisions to 2017/18 figures included those for China (+500,000, from 38.0 to 38.5 million) and India (-250,000, from 24.8 to 24.5 million).
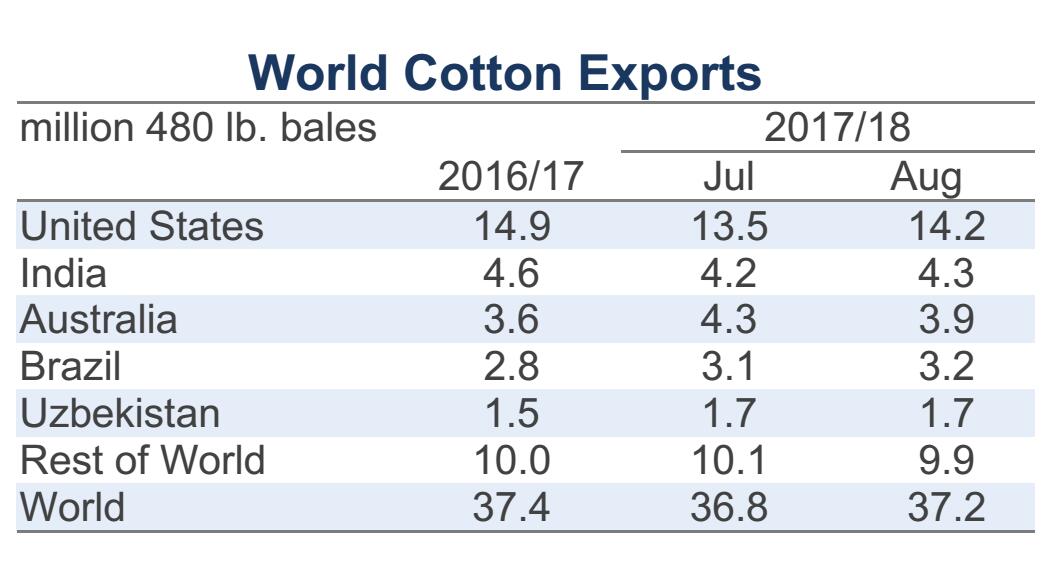
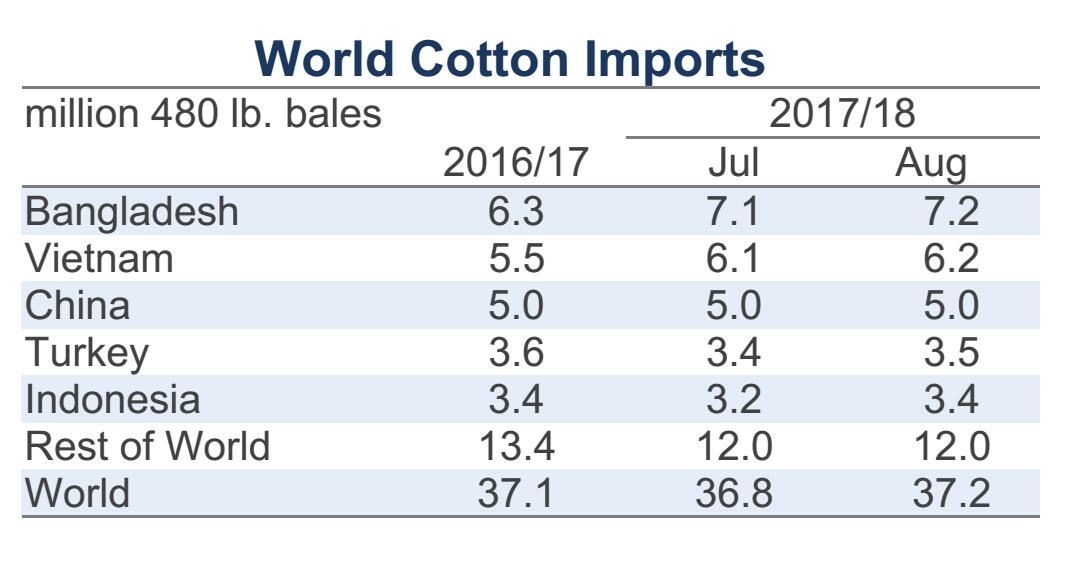
World trade figures were revised slightly higher (+420,000 bales, from 36.8 to 37.2 million). The largest country-level updates for 2017/18 imports were for Indonesia (+150,000, from 3.2 to 3.4 million), Bangladesh (+100,000, from 7.1 to 7.2 million), Vietnam, (+100,000, from 6.1 to 6.2 million), and India (-100,000, from 1.4 to 1.3 million). The largest non-U.S. country-level updates for 2017/18 exports were for India (+100,000, from 4.2 to 4.3 million), Brazil (+100,000, from 3.1 to 3.2 million), and Australia (-350,000 bales, from 4.3 to 3.9 million). There was also a notable change to U.S. exports in 2016/17 due to the strength of shipments in recent months (+417,000 bales). At 14.9 million bales, U.S. exports in 2016/17 rank as the second highest on record (the highest volume was in 2005/06, when U.S. exports were 17.7 million).
With the upward revision to global production exceeding the upward revision to global mill-use, the projection for global ending stocks increased (+1.4 million bales, from 88.7 to 90.1 million). With the forecast for Chinese ending stocks unchanged, all of this additional supply is expected to accumulate outside of China. Stocks outside of China are now expected to rise 9.2 million in the coming crop year, representing a 22% increase (from 41.6 in 2016/17 to 50.7 million in 2017/18). The current forecast for ending stocks held in the world-less-China exceeds the previous record (44.8 million bales in 2014/15) by 5.9 million bales or 13%.
Price outlook
With cotton in storage outside of China generally available for trade, the record ending stocks in the world-less-China can be expected to weigh on prices. The market’s reaction on the day this month’s USDA report was released was to drop sharply. However, the large harvest expected in the U.S. and other countries outside of China (at 92.8 million bales, the collective world-less-China crop is forecast to be the second largest on record, only behind the 2011/12 crop of 93.7 million bales), will not be available for shipment and use until it is actually harvested and ginned. The bulk of that harvest is still several months away. If the relatively low level of U.S. ending stocks for 2016/17 can be interpreted as near-term shortness of supply and if the high level of U.S. committed export sales for 2017/18 (6.4 million bales as of August 4th) can be interpreted as near-term strength of demand, there is some opportunity for near-term upward movement.
Another sign of strength in demand comes from China. In late July, the Chinese government announced it would be offering an additional 414,000 tons (1.9 million bales) of Xinjiang-grown cotton for sale (cotton from Xinjiang province generally recognized as being higher quality than cotton from other Chinese growing regions). Given that this announcement was made near the end of the scheduled period for auctions from reserves (March-August), it was followed by another announcement indicating that reserve sales would be extended for another month as they were last year. In the current round of sales, the Chinese government has already sold 10.3 million bales. No details have been released by the Chinese government regarding imports. When released, those details will inform the question of whether or not China will absorb a portion of the large increase in stocks expected to build outside of China this crop year.