Monthly Cotton Economic Letter (2017.07)
Aug 28, 2017 | by Flora
Recent price movement
Benchmark cotton prices were either flat or lower over the past month.
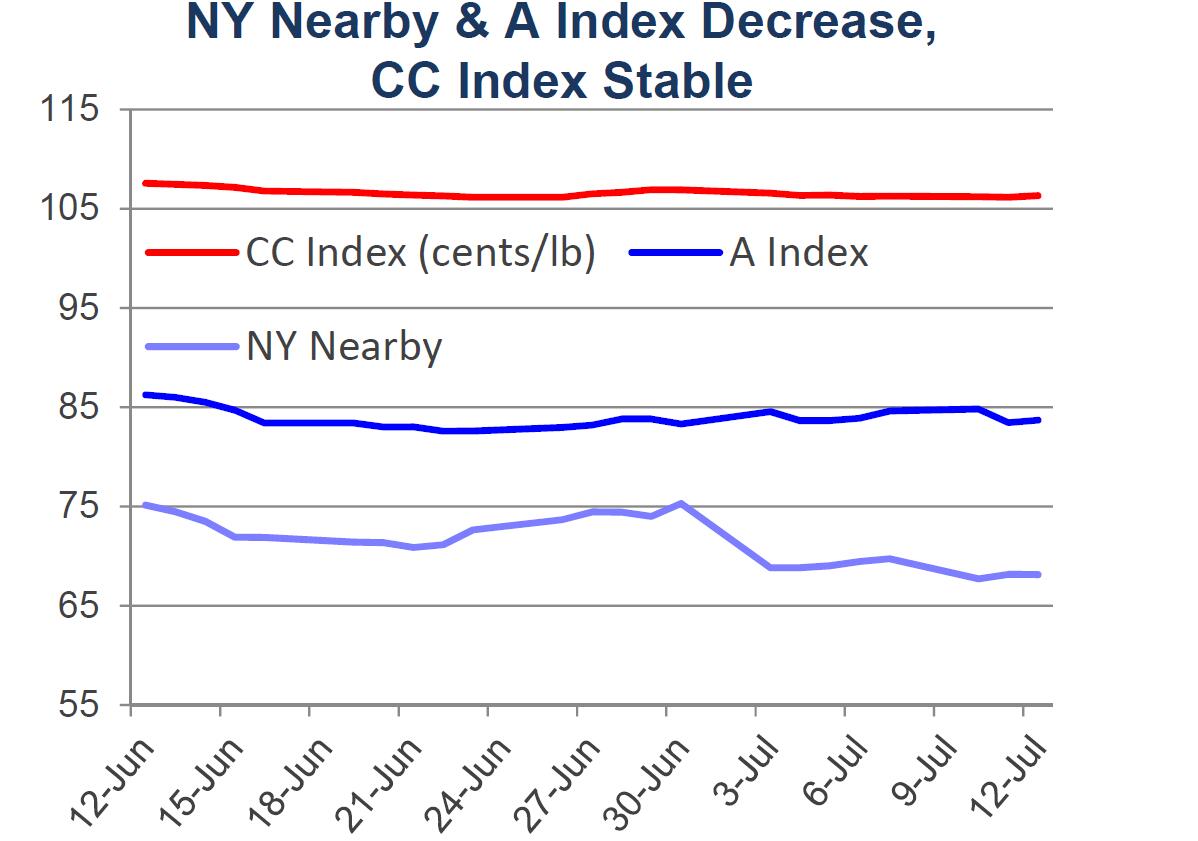
l Prices for the NY December futures contract decreased between mid-June and mid-July, falling from values near 73 cents/lb to those near 67cents/lb.
l This time of year, Cotlook publishes two versions of the A Index. The “A Index” refers to quotes being offered for supply from the soon to expire crop year (with shipment no later than August/September). With that timeframe closing, the alternate “Forward A Index”, which refers to quotes being offered for deliveries from supply in the upcoming crop year (shipment no earlier than October/November), is likely a better indicator of global prices during the month of July. Given widespread expectations for an increase in supply in 2017/18, prices for the Forward A Index have been trading at levels about 6 cents/lb lower (currently near 77 cents/lb) than those for the A Index (currently near 83 cents/lb). Current values for the A Index are about 3 cents/lb lower than they were one month ago. Current values for the Forward A Index are about 5 cents/lb lower than they were one month ago.
l The China Cotton (CC) Index was stable over the past month. In international terms, prices held to levels near 106 cents/lb. In domestic terms, prices were near 16,000 RMB/ton.
l Cash prices for the Indian Shankar-6 variety were stable in international terms in recent weeks, holding to levels near 85 cents/lb. In domestic terms, values held to levels near 43,000 INR/candy.
l Pakistani prices fell sharply in recent trading, dropping from levels near 77 cents/lb in late June to levels near 70 cents/lb most recently. In domestic terms, prices fell from 6,800 to 6,100 PKR/maund.
Supply, demand, & trade
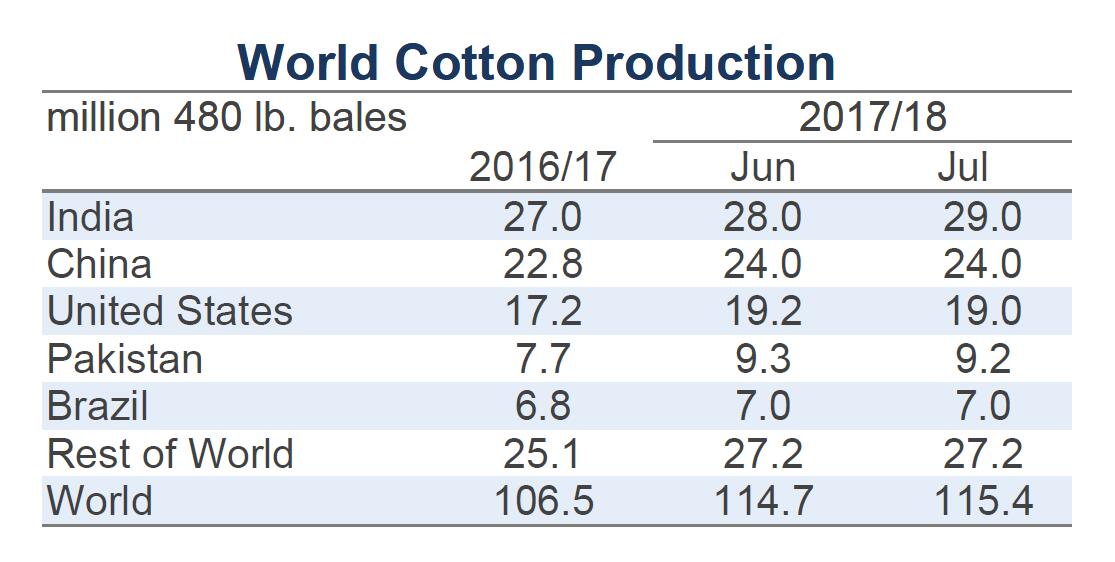
This month’s USDA report featured additions to global production and mill-use figures for both the soon-to-end 2016/17 and the soon-to-begin 2017/18 crop years. The 2016/17 harvest estimate increased 553,000 bales to 106.5 million. The 2017/18 harvest forecast increased 636,000 bales to 115.4 million. The 2016/17 mill-use estimate increased 195,000 bales to 113.8 million. The 2017/18 mill-use forecast increased 515,000 bales to 117.0 million.
With gains in production exceeding additions to consumption, figures for global ending stocks were revised higher for both 2016/17 (+934,000 bales, to 90.3 million) and 2017/18 (+1.0 million bales, to 88.7 million). Despite the forecast for a contraction in global stocks in 2017/18 (-1.6 million bales from 2016/17 to 2017/18), the USDA’s forecast for ending stocks for the world-less-China in 2017/18 suggests that stocks outside of China will rise to a new record (exceeding the previous record by 10%, 49.4 million bales in 2017/18 versus the previous record of 44.8 million in 2014/15).
At the country-level, the largest changes to 2017/18 production numbers included revisions for India (+1.0 million bales, to 29.0 million), Turkey (+100,000, to 3.8 million), Mexico (-100,000, to 1.2 million), Pakistan (-150,000, to 9.2 million), and the U.S. (-200,000, to 19.0 million). An upward revision to India’s production estimate for 2016/17 drove the upward revision to the global figure that crop year (+500,000, to 27.0 million).
The only significant country-level revision to 2017/18 mill-use figures was the one for India (+550,000 bales, to 24.8 million). Notable 2016/17 revisions included those for India (+250,000 bales, to 24.0 million), Vietnam (+100,000 bales, to 5.4 million), and Turkey (-100,000 bales, to 6.2 million).
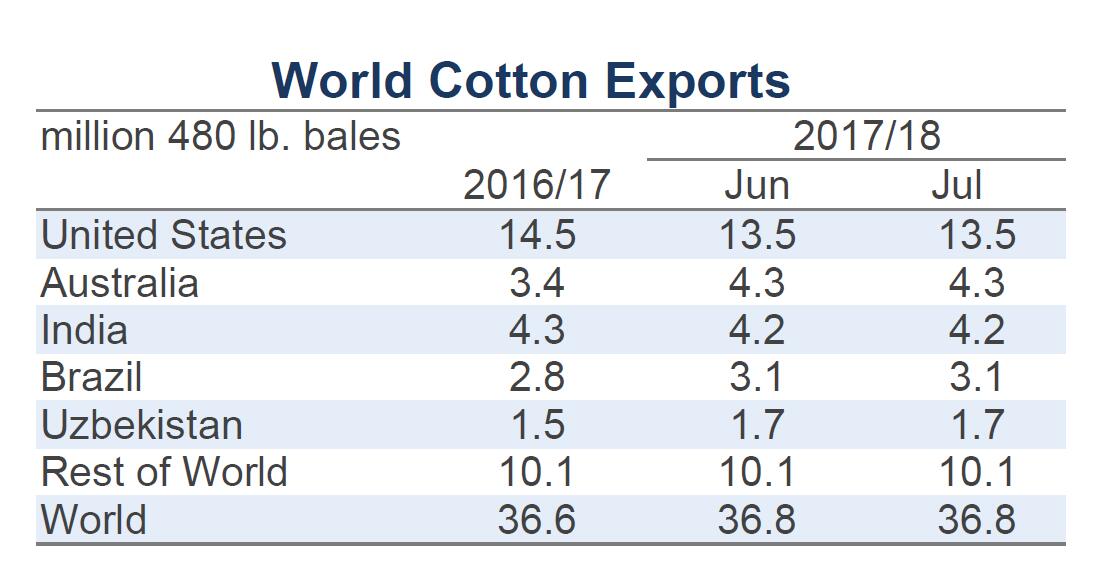
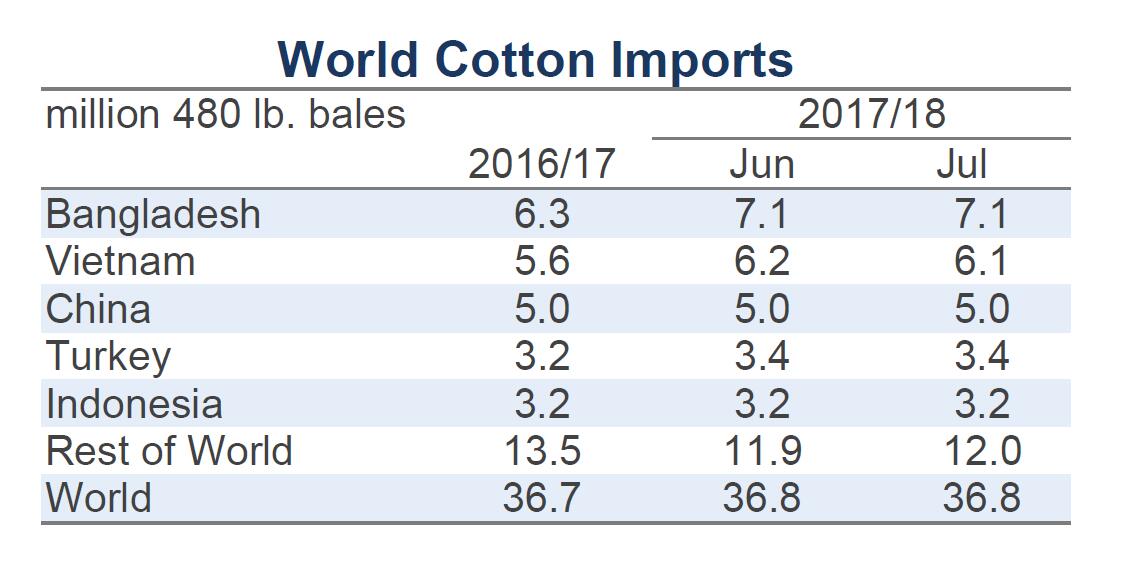
The global trade forecast for 2017/18 was nearly unchanged at 36.8 million bales, but was revised slightly higher for 2016/17 (+325,000 bales, to 36.7 million). The largest revisions to 2017/18 import figures were for India (-350,000 bales in 2017/18, to 1.4 million), Pakistan (+200,000, to 2.2 million), and Vietnam (-100,000 bales, to 6.1 million). The largest updates to 2016/17 import figures were for Vietnam (+200,000 bales, to 5.6 million) and India (+100,000 bales, to 2.6 million). In terms of exports, there were no major revisions to 2017/18 forecasts. The largest revisions to 2016/17 export estimates were for Australia (-400,000 bales, to 3.4 million) and India (+100,000 bales, to 4.2 million).
Price outlook
The end of the crop year is an appropriate time to reflect on developments that defined price movement over the past twelve months. A dominant feature of the global cotton market in 2016/17 has been the strength of U.S. export sales. Relative to the USDA’s forecast released last July, the current estimate is more than 25% higher (forecast of 11.5 million bales in July 2016, current estimate is 14.5 million). Early in the 2016/17 crop year, U.S. sales were supported by the tight supply situation in India and Pakistan. This created import demand from both countries and implied limited competition from India for exports to other countries. India had a larger harvest in 2016/17, but lingering effects from India’s surprise currency-related reforms in November inhibited Indian cotton from competing for international import demand. This was another factor supporting demand for U.S. cotton, and is reflected in the expansion of U.S. share of world exports, which rose from 26% in 2015/16 to 40% in 2016/17. Since global import demand was only slightly higher than it was in 2015/16 (36.6 million bales in 2016/17, 35.3 million bales in 2015/16), the increase in U.S. market share is the reason why the U.S. was able to register the second highest volume of exports in history (14.5 million bales in 2016/17, record of 17.7 million bales in 2005/06). The fact that the U.S. was able to export so much cotton in 2016/17 is remarkable because it was a crop year when China, which has traditionally been the dominant market for U.S. exports, was holding import quotas at low level.
For cotton prices, the strong rate of U.S. export sales had several effects. With many export sales negotiated through on-call contracts, one of these was a record volume of unfixed on-call sales. Because unfixed on-call sales represent short positions in NY futures that have to eventually be exited through the purchase of offsetting long positions, this was a likely driver of speculative investment, and therefore was a factor pulling speculative net long positions to a series of record highs (long positions are bets that prices will increase). In turn, the concentration of speculative investment on the long side of the market likely pulled NY futures higher. With NY futures used to hedge cotton internationally, the A Index increased, and the strength of international cotton prices relative to those for competing crops led to the increase in acreage in 2017/18.
The corresponding increase in production next crop year is the driving force behind the forecast for record ending stocks in the collection of countries outside of China. Since this cotton can be freely traded, it represents a higher level of competition for U.S. exports. Several factors related to the strong rate of U.S. sales in 2016/17 have already started to unwind, notably the speculative net long position has been sharply reduced.
The extent to which the U.S. is able to maintain export sales in the coming crop year can be a factor that influences how low prices may go.