Monthly Cotton Economic Letter (2018.7)
Jul 25, 2018 | by

Recent price movement
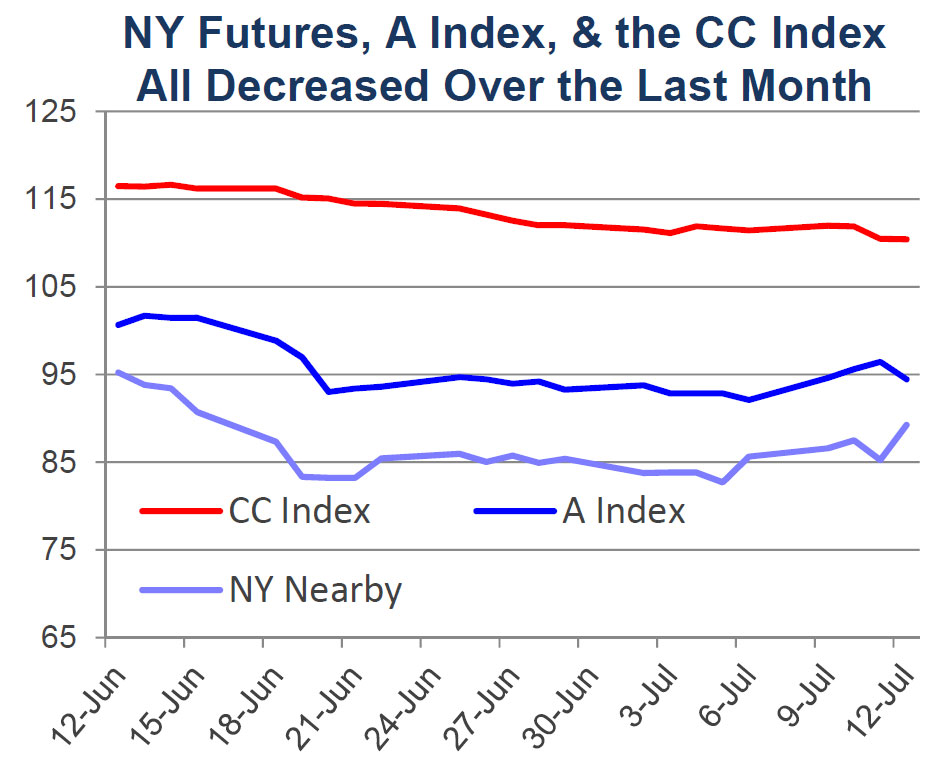
NY Futures and the A Index moved sharply lower in the middle of June, erasing gains made earlier that month. The CC Index decreased in June and early July. Indian prices were comparatively stable in USD terms. Pakistani prices were stable in June, but increased in early July.
l After climbing to levels over 92 cents/lb in mid-June, values for the December NY Futures contract retreated and had been stable near 85 cents/lb. With the release of the USDA’s latest report (July 12), December futures increased the limit (4 cents/lb).
l Movement in the A Index followed NY futures, with values falling from 102 to 92 cents/lb between mid-June and early July. The latest reading for the A Index (July 12) is 94 cents/lb.
l Chinese spot prices, as represented by the Chinese Cotton (CC) Index (3128B grade), decreased in both domestic and international terms (from 117 to 110 cents/lb or from 16,500 to 16,100 RMB/ton). The RMB 4% dropped against the dollar over past month.
l By comparison, Indian spot prices (Shankar-6 quality) were stable, holding to levels near 88 cents/lb or near 47,000 INR/candy.
l Pakistani spot prices were stable throughout most of June, but increased in July, rising from 76 to 83 cents/lb or from 7,500 to 8,300 PKR/maund.
Supply, demand, & trade
This month’s USDA report featured a slight reduction to the global 2018/19 harvest forecast (-290,000 bales, to 120.1 million) and a series of upward revisions to historic and projected figures for global mill-use. June’s forecast for world consumption in 2018/19 predicted record use, and the current figure is 1.6 million bales higher (127.0 million).
Historic revisions to spinning estimates were focused on China, with figures for Chinese mill-use raised by half a million bales in 2014/15 (to 34.5 million) and by one million bales each crop year from 2015/16 through 2018/19 (to 42.5 million for 2018/19). When compounded over the five-year period between 2014/15 and 2018/19, an effect of higher than previously estimated Chinese use is lower than previously estimated Chinese stocks. With the updates, the current forecast for Chinese ending stocks in 2018/19 dropped 4.6 million bales relative to last month (-14%, from 33.1 to 28.5 million). At its current level, the projection for Chinese ending stocks in 2018/19 is still above levels that were common throughout the 2000s (ranged between 17.5 and 22.5 million bales between 2000/01 and 2008/09), but is also less than half the volume when Chinese stocks reached their peak in 2014/15 (66.4 million).
Outside China, upward revisions to mill-use figures were made for Bangladesh (+200,000 bales, to 8.0 million) and Pakistan (+200,000, to 10.7 million). There were no decreases.
In terms of production, the largest change was for the U.S. harvest in 2018/19 (-1.0 million bales, from 19.5 to 18.5 million), where dry conditions in the Southwest growing region (Texas, Oklahoma, and Kansas) led the USDA to increase their abandonment forecast to 35% ofplanted acres. At the world-level, the decrease in the U.S. number was partially offset by increases for Brazil (+500,000, to a record 9.5 million), India (+200,000, to 28.7 million), and Mexico (+150,000, to 1.8 million).
The changes to historical figures for China, along with a lower production forecast for the U.S., led the projection for 2018/19 global ending stocks lower (-5.2 million bales versus June’s estimate, to 77.8 million). Year-over-year, world ending stocks are expected to decline 7.1 million bales. This is driven by a 9.2 million bale reduction expected in China. Stocks for the world-less-China are still expected to increase in 2018/19 (+2.0 million bales, to a record 49.3 million bales).
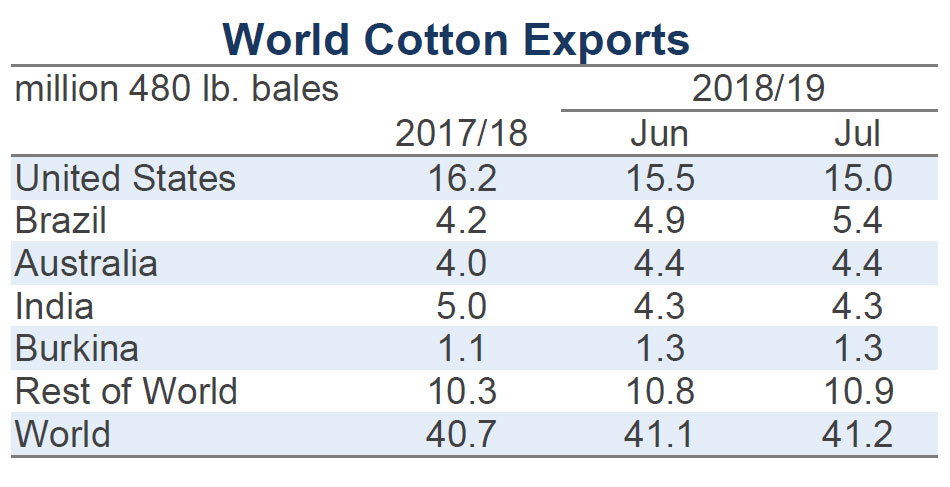
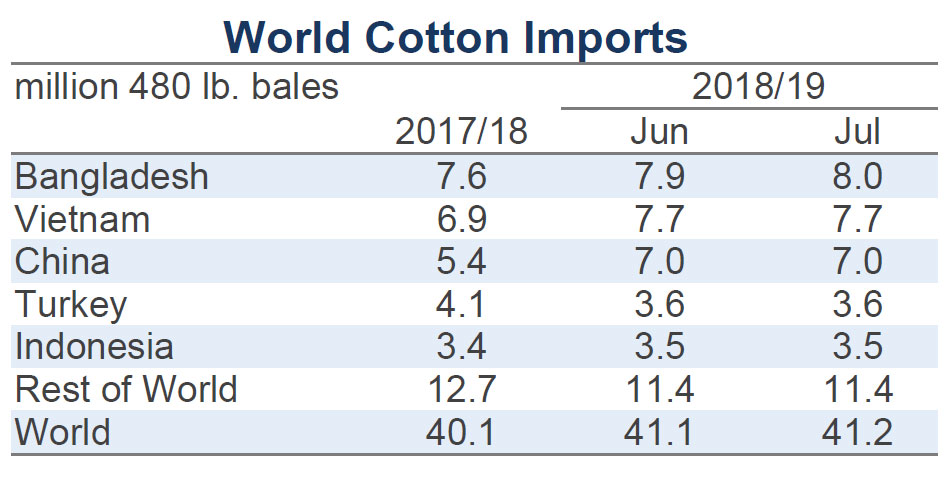
Predictions for world trade were increased slightly (+175,000 bales, from 41.1 to 41.2 million bales), with stronger demand expected from Bangladesh (+100,000, to 8.0 million) and Pakistan (+100,000, to 2.3 million). The U.S. export number for 2017/18 was increased due the strength of recent shipment data (+200,000 bales, to 16.2 million), but was lowered 500,000 bales for 2018/19 due to expectations of a smaller crop. The only other notable change to 2018/19 export figures was for Brazil (+500,000 bales, to a record 5.4 million). The Indian export forecast for 2017/18 was increased 250,000 bales, to 5.0 million).
Price outlook
The decrease in cotton prices that occurred around the middle of June was coincident with indications that the U.S. and China would pursue tariffs increases. Hopes for an agreement that could have avoided implementation were dashed when the July 6th deadline was reached. As a result, lists of U.S. and Chinese goods valued at $34 billion faced a 25 percentage point increase in duty rates. The Chinese list includes U.S. cotton fiber.
Additional lists from both sides, valued at $16 billion, are expected to face 25 percentage point increases in the next few months. On top of that, the U.S. just released another list of Chinese goods worth $200 billion that could be hit with a 10 percentage point increase in duties. This $200 billion list includes a wide range of intermediate textile goods (HS Chapters 50-60), but excludes finished apparel and home textiles (HS Chapters 61-63). However, the U.S. has threatened to develop a second $200 billion list of Chinese goods that could include finished apparel and home textile items.
The ultimate consequences of these trade/tariff negotiations is unknown, beyond the simple fact that they have introduced another layer of uncertainty. And, given China’s expected transition to higher levels of imports, the cotton market was already facing a significant amount of uncertainty. This can be observed in the separation between forecasts for Chinese imports in 2018/19. Cotlook’s current import forecast of 11.4 million bales (2.5 million tons) is much higher than the USDA’s projection of 7.0 million bales. Stocks outside of China are forecast to increase to a new record in 2018/19 (USDA estimates), but the projected increase in world-less-China stocks of two million bales in 2018/19 would be more than reversed if Chinese imports end up matching Cotlook’s current estimate.


