Monthly Cotton Economic Letter (2018.1)
Feb 09, 2018 | by Cotton Incorporated
RECENT PRICE MOVEMENT
All benchmark prices except the CC Index increased over the past month.
· Prices for the March NY futures contract surged in late December, rising from 75 cents/lb to just below 80 cents/lb. Following that round of increases, there was a period of stability. However, in the latest trading, prices have risen once again, with March futures testing levels near 85 cents/lb. Current prices are the highest for a nearby NY futures contract since May.
· As is common, movement in the A Index was highly correlated with that for NY futures, with values increasing from levels near 85 cents/lb in late December to those near 90 cents/lb most recently.
· The China Cotton Index (CC Index, base grade 3128B) was stable over the past month. In international terms, the CC Index held to levels near 109 cents/lb. In domestic terms, the CC Index eased slightly, falling from 15,800 to 15,700 RMB/ton.
· Indian spot prices (Shankar-6 quality) increased, climbing from 75 to 81 cents/lb in international terms over the past month. In domestic terms, prices increased from 38,000 to 40,000 INR/candy.
· Pakistani prices also rose, moving from 75 to 84 cents/lb in international terms and from 6,600 to 7,600 PKR/maund in domestic terms.
SUPPLY, DEMAND, & TRADE
This month’s USDA report featured increases in global figures for both production (+1.0 million bales, from 120.0 to 121.0 million) and mill-use (+1.2 million bales, from 119.6 to 120.8 million). The slightly larger increase in consumption relative to production resulted in slightly lower forecast for global ending stocks (-0.2 million bales, from 88.0 to 87.8 million).
Both before and after this month’s revision, at the country-level, the only major producer or consumer of cotton expected to have a significant year-over-year decrease in stocks in 2017/18 is China (-8.7 million bales, from 48.4 to 39.8 million). For the world-less-China, ending stocks are projected to increase 8.8 million bales (from 39.2 to 48.0 million).
Notable country-level changes to harvest figures included those for China (+1.4 million bales, from 25.0 to 26.4 million), India (-200,000, from 29.5 to 29.3 million), the U.S. (-177,000, from 21.4 to 21.3 million), and Australia (-100,000, from 4.7 to 4.6 million).
For consumption, the only notable country-level change to mill-use figures was for China (+1.0 million bales, from 39.0 to 40.0 million). In China, mill-use is now expected to grow 2.5 million bales year-over-year. Countries outside of China with significant year-over-year growth include Vietnam (+850,000, from 5.4 to 6.3 million), India (+750,000, 24.0 to 24.8 million), and Bangladesh (+500,000, from 6.7 to 7.2 million). Globally, mill-use is forecast to grow 6.2 million bales year-over-year, representing the strongest increase in bale volume since 2009/10 and a growth rate (+5.2%) more than double the long run average (near two percent).
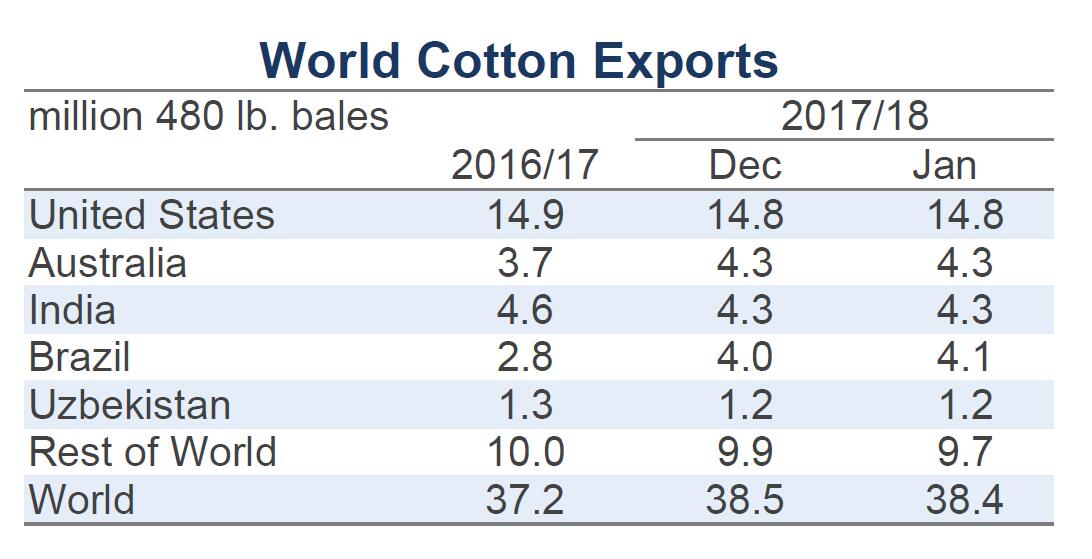
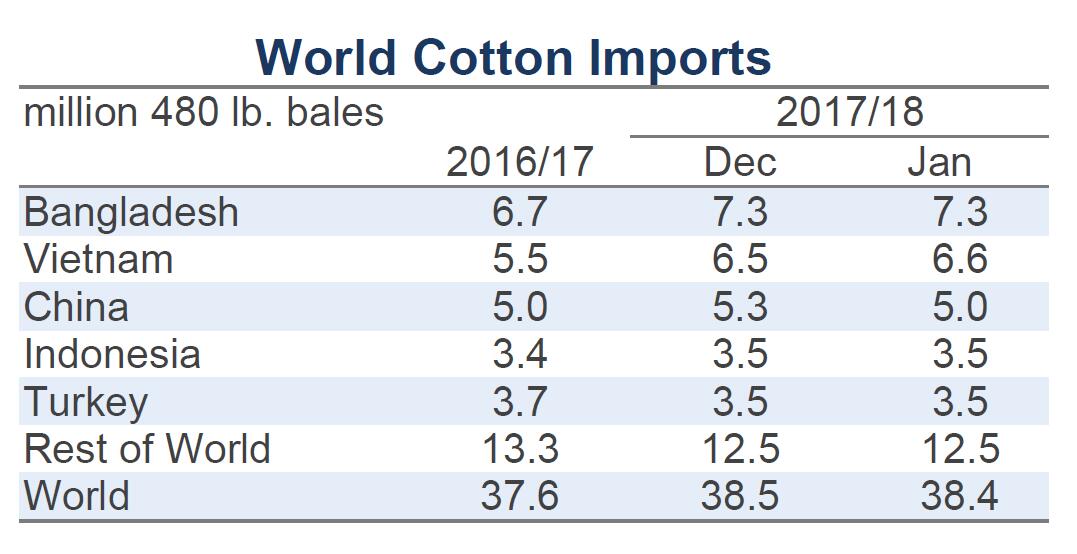
At the world-level, there was only a marginal change to the trade forecast (-115,000 bales, from 38.5 to 38.4 million). In terms of imports, the only notable revisions were for China (-300,000 bales, from 5.3 to 5.0 million) and Vietnam (+100,000, from 6.5 to 6.6 million). In terms of exports, the only notable revisions were for Argentina (-100,000, from 200,000 to 100,000) and Brazil (+100,000, from 4.0 to 4.1 million).
PRICE OUTLOOK
Supply and demand forecasts and the direction of cotton prices remain in conflict. Cotton stocks outside of China are projected to increase by more than 20% year-over-year and this suggests a new record for stocks held by countries outside of China. Relative to the existing record (44.2 million bales set in 2014/15), the projection for world-less-China stocks in 2017/18 is nearly 10% higher, leaving a healthy margin for error.
Last crop year, the increases in prices around this same time of year served as an indication that supply and demand estimates were in need of revision. At this time last year, stocks outside of China, and notably stocks in the U.S., were also projected to strongly increase. However, unseasonably strong export sales throughout the winter and spring instead caused U.S. stocks to decrease.
Currently, U.S. ending stocks are projected to more than double in 2017/18 (from 2.8 million to 5.7 million). In order for that projection to once again reverse to a decrease, U.S. exports would need to climb 2.9 million bales beyond the current USDA forecast (14.8 million bales). The corresponding level of 17.7 million bales would match the record set back in 2005/06, when the U.S. shipped over nine million bales to China. That volume is nearly twice the amount expected to be imported by China from all sources this crop year (5.0 million bales). Although there has been increased demand for U.S. exports from other markets since 2005/06, it is difficult to see how U.S. exports could get to a level that high again without Chinese imports rising well- above the current forecast. There are rumors that China may import more this crop year, possibly to bring more foreign cotton into its reserve system, but currently, these remain only rumors.
Independent of purely supply and demand driven factors, there are other potential reasons for recent price increases. One of them is the high level of unfixed on-call sales. Unfixed on-call sales represent sales that merchants have made to mills that lock in quantity, quality, and delivery costs (known as the basis), but not the total price. The eventual total price will be the sum of the already agreed upon basis and the futures price when the mill decides to “fix” the unfixed on-call contract. When the contract is fixed, the merchant exits the underlying short hedging position in futures by buying an offsetting long position. When many mills fix contracts at the same time, the resulting buying activity can prevent prices from moving lower or potentially push prices higher.Since September, the volume of unfixed on-call sales has been perpetually setting records. Last year, records for unfixed on-call sales were also being set. Nonetheless, in the latest available data (for January 5th), the volume of on-call sales is 40% higher than it was a year ago. Until these very high levels of unfixed sales start to move lower, they could remain an important influence on prices.


