Status quo of China’s garment industry (Jan. - Nov., 2015)
Mar 07, 2016 | by
By Zhao Zihan
In the face of the complex development environment in 2015, such as the economic slowdown adjustment, continuous slump in export demand, and the increasingly rising factor costs, China’s garment industry made an active respond to speed up structural adjustment as well as transformation and upgrading. As a result, the overall industry enjoyed a basically sound development together with a steady growth of the main economic efficiency indicators.
Overall steady growth
Steady but moderate growth in production
During the first 11 months of 2015, the above-designated garment enterprises presented a relatively stable output with a slow growth. The data from National Bureau of Statistics showed that from January to November in 2015, the above-designated garment enterprises saw a total garment output of 27.88 billion pieces, an increase of 2.15% year on year. The previous increasingly downward trend was brought to a close by the cumulative growth rate in November. The woven garments grew by 4.78% to 14.846 billion pieces, while the knitted garments fell by 0.69% to 13.035 billion pieces. Knitwear production has witnessed a continued negative growth since last April, mainly due to a larger decline in exports of knitted garments. (Table 1)
During the first 11 months of 2015, the above-designated garment enterprises presented a relatively stable output with a slow growth. The data from National Bureau of Statistics showed that from January to November in 2015, the above-designated garment enterprises saw a total garment output of 27.88 billion pieces, an increase of 2.15% year on year. The previous increasingly downward trend was brought to a close by the cumulative growth rate in November. The woven garments grew by 4.78% to 14.846 billion pieces, while the knitted garments fell by 0.69% to 13.035 billion pieces. Knitwear production has witnessed a continued negative growth since last April, mainly due to a larger decline in exports of knitted garments. (Table 1)
Table 1 Garment output of the above-designated enterprises, Jan. - Nov., 2015
|
Item |
Enterprise number |
Output (million pieces) |
Y/Y (%) |
|
Garments |
10,701 |
27,880.32 |
2.15 |
|
Woven garments |
7,426 |
14,845.58 |
4.78 |
|
Of them: Down coats |
470 |
305.90 |
-0.79 |
|
Twin-set suits |
629 |
529.72 |
3.23 |
|
Shirts |
677 |
981.24 |
-2.88 |
|
Knitted garments |
4,146 |
13,034.74 |
-0.69 |
Source: National Bureau of Statistics
From January to November, 2015, China’s top five garment-producing provinces, i.e. Guangdong, Jiangsu, Fujian, Zhejiang and Shandong, saw a total garment output of 20.275 billion yuan, up 2.17%, accounting for 72.72% of the total in China. That proportion has remained at 72% - 75% since 2012, from which, it can be seen that the traditional large garment-producing provinces played an obvious role as a stabilizer.
Increasing expansion of total domestic sales
China’s overall retail of clothing products achieved steady growth in 2015, while the total domestic sales continued to expand. The data from National Bureau of Statistics showed that in the first 11 months last year, total retail sales of social consumer goods reached 27.2296 trillion yuan, up 10.6%, of which, the above-norm unit retail sales increased by 7.8% to 11.9185 trillion yuan, while the clothing retail sales were totaled 848.8 billion yuan, an increase of 9.6%. (Fig. 1)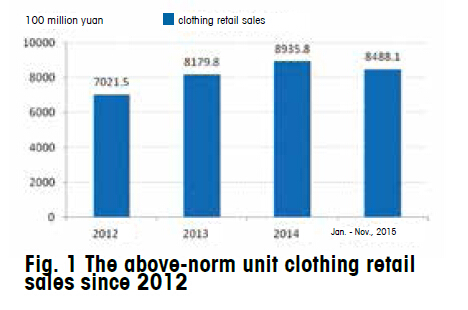
Negative growth in exports
Table 2 China’s garment exports from Jan. - Nov., 2015
|
|
Volume (million pieces) |
Value (million yuan) |
Unit price (USD/piece) |
Y/Y in volume (%) |
Y/Y in value (%) |
Y/Y in unit price (%) |
|
Apparel and clothing accessories |
- |
158,628.66 |
- |
- |
-7.64 |
- |
|
Total garments |
27,580.99 |
127,353.62 |
4.62 |
-7.89 |
-8.2 |
-0.22 |
|
Knitted garments and accessories |
- |
75,401.37 |
- |
- |
-10.85 |
- |
|
Knitted garments |
17,687.17 |
64,003.35 |
3.62 |
-12.8 |
-11.89 |
1.12 |
|
Woven garments and accessories |
- |
70,903.48 |
- |
- |
-4.25 |
- |
|
Woven garments |
9,893.83 |
63,350.27 |
6.4 |
2.42 |
-4.13 |
-6.43 |
Source: China Customs
Among four major export markets, driven by the steady recovery of U.S. economy and gradual increase of consumption expenditure, from January to November in 2015, China’s garment exports to the U.S. maintained modest growth, 5.723 billion pieces in volume with an increase of 8.35%, and 32.806 billion USD in value with an increase of 6.26%, 1.13 percentage points positive impetus to the total exports. (Fig. 2)
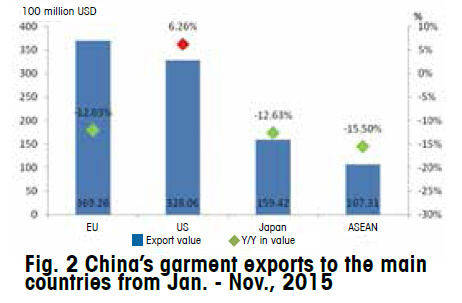
The latest data from China Customs showed that garment imports of the European Union, Japan and the United States from China still remained stable, respectively growing by 6.61%, 2.34% and -0.18%.
A high growth rate of investment
The investment growth rate in the garment industry during the first 11 months last year first went up and then down, overall at a high growth rate which was significantly higher than the national manufacturing, consumption manufacturing and textile industries, showing that the stable and sound economic performance had increased the investor confidence. Meanwhile, the industry was at a critical period of transformation and upgrading, which was mainly contributing to the investment growth. According to the National Bureau of Statistics, from January to November 2015, China’s garment industry saw actual investment of 411.996 billion yuan, up 23.33% with 4.88 percentage points higher than that in 2014. The number of new projects reached 6,366, growing by 21.56%, 20.7 percentage points higher than that in 2014.
Stable growth in benefits
The data from National Bureau of Statistics showed that during the first 11 months last year, 15,586 above-designated garment enterprises witnessed total main business income of 1,984.423 billion yuan with a year-on-year increase of 5.94%, while the total profit grew by 5.01% to 112.802 billion yuan, further expanding the benefit scale of the industry.
Increasing development pressures
Lack of motivation in the domestic market
According to National Bureau of Statistics, during the first 11 months in 2015, clothing retail sales growth was lower than the growth rate of total retail sales of social consumer goods by 1.0 percentage point, down 1.3 percentage points compared with the same period last year. Since 2013, the former has been lower than the latter, therefore, there was lack of motivation of domestic demand in support of the development of the industry.
Despite the different performance of different sales channels together with various degrees of growth, the growth rate has showed somewhat downward trend. According to the National Bureau of Statistics, China National Commercial Information Center and CATA (China Commercial Circulation Association of Textile and Apparel) of China National Textile and Apparel Council, from January to November, 2015, national clothing products saw a gradually declined online retail growth rate, respectively down 10.2, 6.6, and 2.8 percentage points over the first quarter, second quarter and third quarter.
The clothing product prices of large department stores presented a downward trend in 2015. The data from China National Commercial Information Center showed that from January to November 2015, the national key large-scale retail enterprises witnessed a year-on-year falling by 2.95% in clothing retail prices, dropping by 7.25 percentage points compared with the same period last year.
More difficulties in exports
Since 2013, garment export has presented a gradual downward trend in both volume and value, facing greater difficulties. 2015 witnessed a rapid decline in export volume, value, and unit price. During the first 11 months of 2015, the garment export value fell by 7.64%, significantly higher than the decrease of 2.2% in total and 13.76 percentage points lower than the same period of 2014. Export volume and average unit price fell by 7.89% and 0.22% respectively .
According to the latest data of garment imports from the EU, the United States and Japan, the proportion of China’s imports from the above three areas decreased year by year, down 1.26,0.62 and 3.73 percentage points respectively compared with the same period in 2014.
Decline in profitability, increase in corporate differentiation
The development of the industry slowed down in 2015 with a slight decline in the overall profitability of the industry and further business differentiation. From January to November 2015, the sales margin and the gross profit margin of above-designated garment enterprises were respective 5.68% and 14.03%, down 0.05 and 0.20 percentage point respectively over the same period in 2014, indicating pressures in corporate profitability. 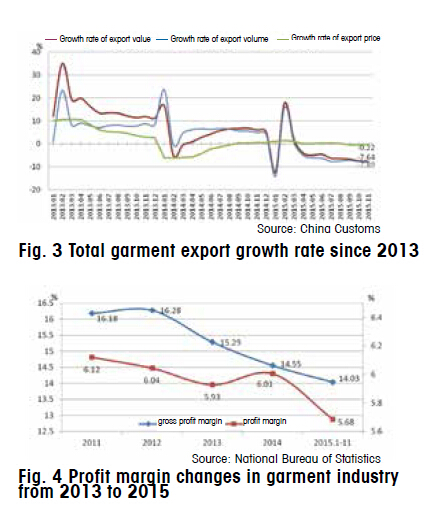
According to the National Bureau of Statistics, from January to November 2015, 2,009 above-designated garment enterprises suffered business losses, and the percentage of businesses suffering losses was 12.89%, decreasing by 0.63 percentage points over the same period in 2014, but the amount of loss-making enterprises increased by 14.5%, showing increased benefit differentiation of the above-designated enterprises. (Fig. 4)
Main factors affecting the development of the industry
Growing costs
According to the National Bureau of Statistics, from January to November 2015, the above-designated garment enterprises saw a total costs of 1.705928 trillion yuan, an increase of 6.20% year on year, higher than the growth rate of main business income of 0.26 percentage point. Main business costs rose by 6.19% year on year, operating expenses by 7.51%, and administrative expenses by 6.95%, respectively 0.25,1.57 and 1.01 percentage points higher than the main business revenue growth. Rising costs further squeeze the profit margins of the garment industry. (Table 3)
Table 3 Main economic indicators of China’s above-designated garment enterprises (Jan. - Nov., 2015)
|
Indicators |
January - November total (billion yuan) |
Y/Y (%) |
|
Main business cost |
1,705.92820 |
6.19 |
|
Main business tax and others |
12.38720 |
6.22 |
|
Operating expenses |
66.49126 |
7.51 |
|
Administrative expenses |
78.81941 |
6.95 |
|
Financial expenses |
13.84598 |
-1.92 |
|
Of which: interest expenses |
11.29376 |
0.84 |
|
VAT payable |
52.08549 |
6.12 |
|
Total |
1,929.55752 |
6.20 |
China National Garment Association conducted a special survey on operating costs of garment enterprises, indicating that garment enterprises are suffering growing operating costs, wherein the fastest rising part goes to labor costs, especially which for sewing workers has continued to increase over the past decade.
Insufficient speed and efficiency of domestic market in respond to the consumption changes
Domestic apparel consumption market saw more than two trillion yuan, and in recent years, national clothing product retail sales and per capita consumption expenditure have been growing at a rate of more than 5%. Although the growth rate of domestic apparel consumption market is gradually slowing down, total consumption is constantly expanding with an annual increase of more than 100 billion yuan on apparel spending.
Demand depression in the international market with intensified competition
In recent years, China’s total garment exports has presented a gradual downward trend, except the international economic situation and depressed international market demand, mainly because the share of exports have been transferring to such countries as Vietnam and Bangladesh owing to the gradual weakening of the existing competitiveness during the international clothing trade remodeling process.