In spite of the various unfavorable factors, the tech-textile industry maintained a stable growth in the first three quarters, by means of strengthening the product development and business expansion, reinforcing the management of enterprises, as well as reducing cost and improving efficiency. According to National Bureau of Statistics, for the enterprises above the designed size in tech-textile industry, the industrial added value increased by 10%, main business income and total profits by 6.83% and 8.59% respectively, as well as the fixed investments flat with last year, while the exports and imports of industry down by 3.42% and 4.55% respectively. According to the research on the member enterprises, the business index was 75.4 in the first three quarters, 3 percentage points higher than the first half year, and flat with the same period of last year.
Production of main products steadily increased
The demand index and production index were respectively 64.8 and 70.3 in the first three quarters, a little better than the same period of last year and the first half of this year, according to the research of the association. China’s above-scale enterprises achieved the production of non-woven and cord fabric of 4.178 million tons and 629 thousand tons, with the year-on-year growth of 6.39% and 8.2% respectively (see Figure 1), while the export growth reached up to 15% and 13.5% in the same period of these two products. The other main products also enjoyed stable growth in export quantity, where the export quantity of coated fabric increased by 6.22%, packaging textiles by 18.02%, airbag by 24.44%, while some traditional products suffered drop to various degrees, where protective and safety textiles decreased by 4.54%, canvas nearly by 11%, ordinary tape products around by 9%. Therefore, over all, the demand of China’s technical textiles still remained stable growth, but the adjustment of demand structure caused the decline of some product output.
Industry investment slowed down
The fixed assets investment of the above-scale enterprises reached 49.37 billion yuan in the first three quarters, an only slight increase by 0.51 year-on-year, with the growth rate fall again compared with the first half of the year (see Figure 2). It made rooms for the industry to digest the rapidly increased production capacity over the past few years, adjust and optimize supply structure, which played a positive role in the sustainable development of the industry, due to the fall of investment speed, closely related to the whole decline of the industry. For different fields, the investment of nonwovens still maintained a growth of 5.6%, cable rope of 1.48%, while textile belt, cord fabrics and canvas sharply decreased by about 10%.
The decline of investment speed led year-on-year fall of the speed of assets and liabilities, with the asset liability ratio down by 1 percentage point, and interest expense by 9%.
Economic benefits continued to improve
According to the National Bureau of statistics, the main business revenue and gross profit of enterprises above the scale amounted to 225.28 billion yuan and 13.35 billion yuan respectively in the first quarters, an increase of 6.83% and 8.59%, with the growth fall compared with last year, but still in the range of medium and high speed growth. The average profit margin of the industry was 5.93%, an increase of 0.14 percentage points; the scale losses of the industry was 10.53%, with total losses of loss-suffering enterprises of 300 million yuan, down by 25.57 year-on-year.
The main business income and total profit of the tech-textile industry was around 30% in 2011, and the speed of total profit maintained stable and higher than the income growth over a period of time, suffering the relatively large decline in 2012, while the difference of the growth of the two indicators narrowed (see Figure 3). The income growth slowed down was caused by that, on the one hand, the price decline of raw materials and fierce market competition led the fall of sale price of products; on the other hand, the demand of partial fields gradually saturated with the maturity of the industry. For the profit structure, the gross profit margin and operating profit ratio have increased in the first quarters.
In terms of industrial divisions, the main business income and total profit of nonwovens increased by 9.45% and 7.22% respectively, the profit rate of 5.89%, and total losses of loss-suffering enterprises down by 28.88%; the total profits was lower than main business income, with a slight drop in profitability, which was mainly caused by the drop of gross profit due to the rising of raw materials prices, while the significant decrease of the losses saw the improvement of differentiation. Although the proportion of ropes and cables was not high, its main business income and total profits increased by 11.52% and 12.01% respectively, and profit margin reached to 6.43%, so with the endless efforts to develop high-tech products, the scope of application would continue to expand with high-speed growth. The income of textile belt and cord fabrics have decreased, but the total profits rose by 5.55% and the losses fell by 67.84%, with profit margin up by 5.93%, while the total profits of canvas grew by 21.23%, indicating that the two industrial divisions has already come out of downturn with gradually improved business conditions.
China Industrial Textiles Association has made in-depth investigation on 12 listed companies on main broad and GEM. In the first three quarters, the fixed assets grew by 11.79% of these listed companies. For the income, there were two companies suffering year-on-year decrease in main business income, while the growth rate of the 12 companies was 8.28%; for profits, 11 companies achieved profitability, but total profits of 6 companies fell year-on-year, and of 12 ones slightly increased 1.49%. The average profit margin of 12 companies was 8.82%, a year-on-year fall of 0.6 percentage point.
According to the investigation of the member enterprises, the main business income and total profits grew by 1.22% and 12.97% respectively, export value by 4.41%. In terms of divisions, nonwovens, transport textiles, filter, medical and hygiene textiles showed good performance. The finished goods price index was 43.2, still lower than the growth and contraction, but has been greatly improved compared with the same period last year and the first half of this year. The raw material price index was 61.4, with a rising trend, which would cause a negative effect on the profitability of enterprises. The inventory and receivables of enterprises were relatively stable.
Import and export both decreased
In the first three quarters, China’s tech-textiles exports reached 18.56 billion dollars, imports of 4.62 billion dollars, down 3.42% and 4.55% year-on-year respectively, of which exports fell larger than the first quarter this year and last year.
Major products
In the nine major products with exports more than 1 billion dollars, only two products saw different degrees of growth in exports, including transport textiles up 11.1%, and nonwovens up 3.87%, while other products showed various rate of decline. However, the export volume presented opposite trend, where only the sail-class products and protective&safety textiles decreased slightly, while the packaging textiles, nonwovens and transport textiles enjoyed significant growth of 18.02%, 15.04% and 14.94% respectively, indicating the international market has a strong demand for Chinese commodity (see Table 1). In the major export products, the export prices of nonwovens and transport textiles basically maintained stable, while packaging textiles, sail-class textiles and ropes & cords decreased by over 10%. The main factor why China’s tech-textile industry fell in export is the fall of price, which is not only related with the low prices of raw materials, but also with the exchange rates among major currencies.
Major market
In the first three quarters, the export volume of China’s tech-textile industry to Asia, the European Union and North America showed varying degrees of decline, but grew by 3.7% to the Non-EU countries.
From the perspective of countries and regions, the exports to top ten countries and regions accounted for more than 50% in China’s total exports of the industry. Among them, Japan was the second largest overseas markets for China’s industrious textiles, with the exports up by 1.57%. In recent years, China’s exports to Vietnam continued to increase, with the growth of 4.27%, making Vietnam exceed the developed countries and as the third largest market of China; Philippines was the ninth market, with the exports rising by 8.89%. In other major markets, the exports to South Korea, India, Germany, the UK, and Indonesia slightly decreased. The United States was the largest export market, and also the strongest market from the perspective of history, but the exports to the US decreased for the first time since 2016, with the fell of 0.42% in the first quarter, 2.96% in the first half of year and 3.57% in first three quarters (see Table 2).
For the export products to Vietnam and Philippines, the export volume of industrial coated textiles, nonwovens, synthetic leather, diapers & sanitary napkin accounted for 60% of the total, of which the export growth of both nonwovens and diapers & sanitary napkin exceeded 12%, but the export volume of coated textiles flat with the same period of last year and export of synthetic leather down by 7%. China’s nonwovens industry has a strong advantage in Vietnam and other countries, and with the improvement of income and acceleration of infrastructure construction in those countries, there will be a larger growth space for China. In addition, the exports of agricultural networks and packaging textiles are also very fast.
Import
China’s imports of industrial textiles amounted to 4.62 billion dollar, a year-on-year decrease of 4.55% in the first three quarters. For the variety, the imports of diapers & sanitary napkins reached 917 million dollar, ranking the largest imports flat with the same period of last year, and the trend of substantial increase was in the control.
Imports of nonwoven and coated fabrics were $614 million and $592 million, down by 6% and 9.19% year-on-year respectively. Airbag saw a strong growth with imports of $474 million, an increase of 14.17%, and the imports of lap-belt also enjoyed a great growth of 28.8% over the same period. Transport textiles witnessed a significant growth in imports, closely related with China’s auto market this year, and the production of China’s passenger cars reached 19.42 million, and increase of 13.25%.
For countries and regions, Japan is the largest source of imports of China’s tech-textile industry, with Japan’s imports of 1.368 billion dollar in the first three quarters, of which the diapers and sanitary napkins accounted for 53%; China’s Taiwan is the second largest one, with imports of 532 million dollar; South Korea, the United States and Germany ranked from the third to Fifth, with imports of 512 million dollar, 375 million dollar and 237 million dollar.
Summary
Even in the face of complex domestic and international environment, China’s textile industry in the first three quarters maintained stable operation, with rapid growth in the main economic indicators, and a better economic benefit, while the growth of production, income, profits and investment suffered decline to a varying degree, causing many challenges to the industry. From the full year, the industry will continue the trend in the first three quarters, where production and main business income kept rapid growth, fixed asset investment is essentially flat with last year and exports will decline slightly.
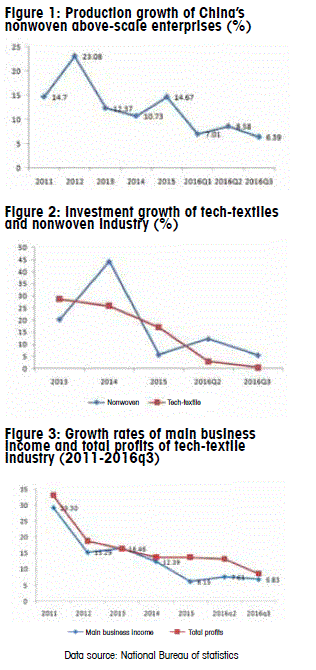
Table 1 Exports of major products of China’s tech-textile industry in the first three quarters
|
Product |
Amount (dollar) |
Change in amount (%) |
Change in quantity (%) |
|
Medical & hygiene textiles |
2,519,129,984 |
-8.23 |
increase |
|
Industrial coated textiles |
2,267,483,945 |
-3.29 |
6.22 |
|
Nonwovens |
1,922,538,055 |
3.87 |
15.04 |
|
Sail-class products |
1,892,657,925 |
-4.07 |
-1.51 |
|
Ropes & cords |
1,813,009,944 |
-5.66 |
8.52 |
|
Synthetic leather |
1,551,564,863 |
-7.34 |
6.56 |
|
Packaging textiles |
1,352,397,359 |
-4.06 |
18.02 |
|
Transport textiles |
1,092,853,815 |
11.10 |
14.94 |
|
Protective & safety textiles |
1,062,409,037 |
-10.04 |
-4.54 |
Table 2: Tech-textiles export countries & regions (Jan. - Sept., 2016)
|
Countries & regions |
Amount (dollar) |
Change in exports (%) |
|
USA |
2,836,672,020 |
-3.57 |
|
Japan |
1,532,324,217 |
1.57 |
|
Vietnam |
966,552,203 |
4.27 |
|
South Korea |
870,478,228 |
-1.26 |
|
India |
718,349,119 |
-2.57 |
|
Hong Kong |
586,678,878 |
-14.52 |
|
Germany |
549,191,547 |
-2.12 |
|
UK |
467,981,986 |
-1.44 |
|
Philippines |
447,903,856 |
8.89 |
|
Indonesia |
437,363,497 |
-2.89 |
Data source: General Administration of Customs