The economic operation analysis of dyeing and printing industry (Jan. - Sept., 2016)
Mar 02, 2017 | by Shirley
From January to September, the above-scale enterprises maintained growth in main economic indicators of total output, main business income, profit, fixed asset investment, export and so on, with the economic operation still at a reasonable range. Meanwhile, the industry restructuring, transformation and upgrading continued to be further promoted.
General operation
Output realized growth
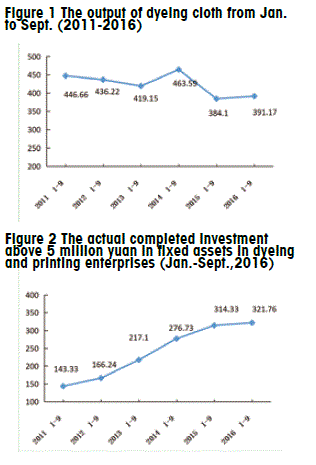
In 1-9 months 2016, the dyeing and printing enterprises above designated size achieved the output of 39.117 billion meters, up by 1.84% with an increase of 18.99 percentage points compared with the same period in 2015. The output of the first nine months reduced 5.549 billion meters from a year earlier, down 12.42%, as shown in figure 1.
Investment growth rate slowed down
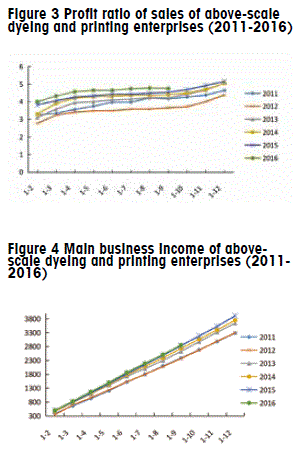
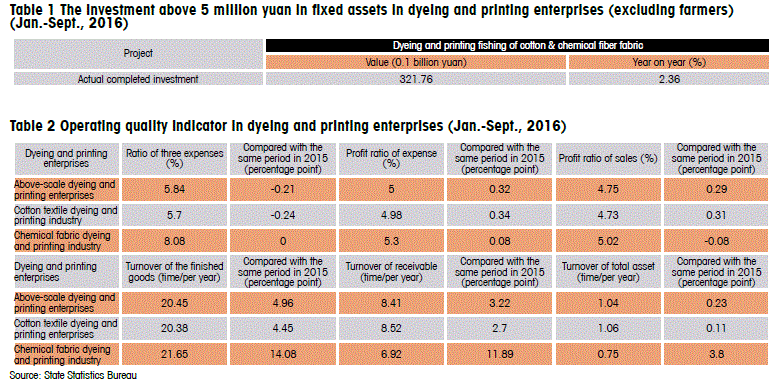
From Jan. to Sept. 2016, the actual completed investment in fixed assets in dyeing and printing enterprises was 32.176 billion yuan (excluding any projects with investment less than 5 million yuan), an increase of 2.36% year on year with 11.23 percentage points dropped. The slowdown in investment growth reflected the investment enthusiasm of enterprises is not high. (See Table 1)
In 1-9 months from 2011 to 2016, the actual completed investment of dyeing and printing enterprises increased year by year. From 2011-2014, the investment increased rapidly, basically double in the three years, while after 2014, the investment growth continued to slow at a low level of growth. (See Figure 2)
The operating quality and efficiency maintained stable
The quality of operation was basically stable
In 1-9 months 2016, the percentages of the three expenses (referring to the costs in sales, overheads and financing) was 5.84%, down by 0.21 percentage point compared with the same period of year 2015, of which, the cotton textile dyeing and printing enterprises was 5.7%, and chemical fabrics dyeing and printing enterprises was 8.08%. The profit ration of expense was 5%, up 0.32 percentage point; the profit ratio of sales was 4.75%, up by 0.29 percentage point; the turnover of finished goods was 20.45 times per year, and increase of 4.96% year on year; the turnover of receivables was 8.41 times per year, up by 3.22%; turnover of total asset was 1.04 times per year, increasing by 0.23%, seeing the improvement of management level and overall operation ability. (See Table 2)
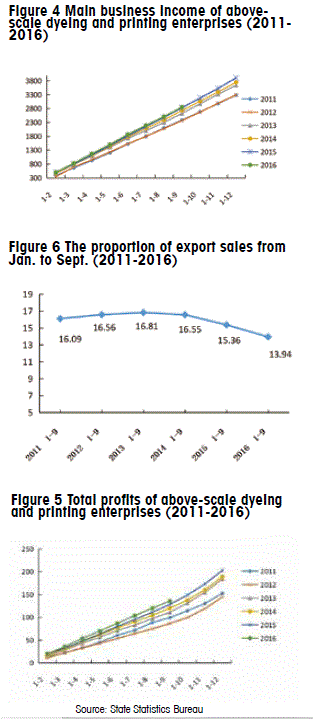
2011 - 2016, the above-scale dyeing and printing enterprises kept the sales profit margin at the level of 3% - 5%. Since 2016, sales profit margin was above 4%, higher than the same period in the previous five years. (See Figure 3)
Benefits steadily improved
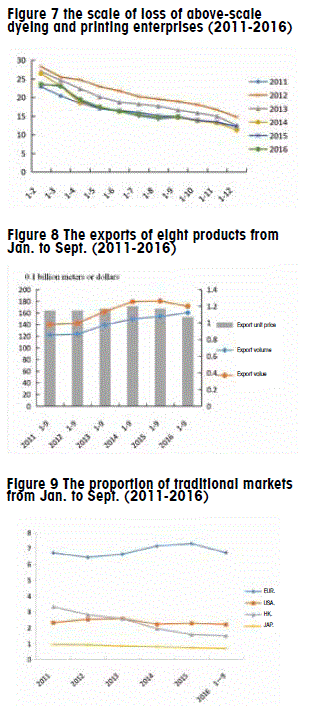
In 1 - 9 months 2016, the dyeing and printing enterprises above designated size realized main business income of 285.189 billion yuan, up by 0.76% with 3.26 percentage points dropped; total profits of 13.548 billion yuan, an increase of 7.29% with 0.27 percentage point dropped, which indicated that in the new normal of weak recovery of global economy, the transformation and upgrading was still further promoted and economic operational quality and efficiency continued to be improved. (See Figure 4 and Figure 5)
Domestic market promoted the development of the industry
In 1 - 9 months 2016, the above-scale enterprises achieved exports of 39.777 billion yuan, a fall of 6.88% with 3.02 percentage points dropped. The proportion of export sales was 13.94%, dropping by 1.42 percentage points compared with the same period of year 2015, and by 2.15 percentage points than year 2011. Since 2013, the proportion of dyeing cloth export showed a decreasing trend year by year, so from1 - 9 months 2016, the domestic output value was over six times than the export value. It showed that with the constant adjustment of market structure in dyeing and printing industry, the domestic market has been strengthening its role to support industry development. Due to the sluggish demands in international market, rising costs of raw materials, intensified competition, trade barriers and other aspects, the export market continued to shrink, but domestic market maintained demand potential. (See Figure 6)
Scale of loss narrowed & loss reduced
In 1 - 9 months 2016, the number of above-scale dyeing and printing enterprises was 263, with scale of loss of 14.85%, down 0.04 percentage point from a year earlier. Total loss amounted to 978 million yuan, fall of 7.52% year on year. (See Figure 7)
Import and export
In 1 - 9 months 2016, the total import and export of the eight products in dyeing and printing industry was USD 18.581 billion, down by 5.77 year on year with 5.18 percentage points lower compared with the same period of year 2015. The trade surplus registered USD 15.637 billion, down by 4.27% with a plummet of 6.7 percentage points. ( See Figure 8)
The import growth increased slightly
From Jan. to Sept., the import quantity of the eight products was 773 million meters, down by 8.52% with an increase of 0.33 percentage point; the imports amounted to 1.472 billion dollars, a fall of 13.02 year on year with 0.06 percentage point decreased; the unit price of import was 1.90 dollar per meter, down by 2.66% with an increase of 1.84 percentage points.
Export volume increased & unit price constantly slowed down
The export quantity of the eight products was 16.009 billion meters, an increase of 4.33%, with 3.99 percentage points decreased; the total exports amounted to 17.109 billion dollars, a fall of 5.09%, with a plummet of 5.83 percentage points; the average unit price of export was 1.07 dollar per meter, down by 9.02% with 7.07 percentage points lower.
Exports of products
For the eight products in dyeing and printing industry, the export volume and value of polyester staple fiber fabric reduced by 10.05% and 13.57% respectively. Export volume and value of cotton blended dyed fabric significantly increased by 121.82% and 82.54% respectively, while the average unit price of export dropped by 17.53% year on year. Although these products accounted for a small proportion, the export increased rapidly in recent years. Synthetic filament fabric accounted for 58.22%, while the export value and average unit price decreased by 0.94% and 10% respectively.the average unite price of those eight products decreased at varying degrees, of which the average price of cotton blended dyed fabric and printed cotton fabric fell significantly year on year.
Main export markets
The export volume of the top ten export markets reached to 6.489 billion meters, accounting for 40.53% of the total; export value amounted to 7.684 billion dollars, occupying for 44.91% of the total. Vietnam was still the biggest export market, and the rest were in the following order, Bangladesh, Indonesia, Nigeria, Benin, Brazil, the United Arab Emirates, Pakistan, India and Togo. The export unit price to Vietnam was 1.90 dollars per meter, higher than the average unit price, and flat with the average import unit price; while the export unit prices to Nigeria, Benin,Brazil, India and Togo were lower than 1 dollar per meter.
Traditional export market
Since Japan's economic growth momentum was still insufficient in the three quarter, with significant fall in import growth, the export volume, value, unit price to Japan were in negative growth. There was the possibility to block the U.S. economic uptrend, so the export volume and export value to the United States suffered varying degrees of reduction. The export volume and value to the EU increased year on year, benefited by the expected stabilization of the EU’s economic growth. The average export unit price to traditional markets fell year on year, especially the U.S. market. The export volume to the EU market increased year by year during the period of the 12th Five-Year, but it showed a downward trend this year; to the United States and Japan were basically stable; to Hongkong declined year by year. (See Figure 9)
Export of emerging markets
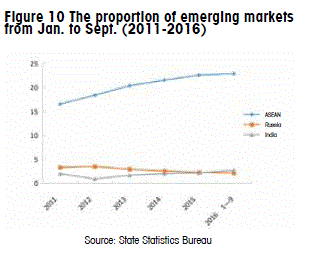
Emerging markets and developing countries still face many difficulties in economic growth, the risk of capital outflows still exist, ad structural reforms need to be further deepened. In 1 - 9 months 2016, the amount of exports to ASEAN reached USD 4.992 billion, down by 2.55%. Exports to Russia depended on the pace of economic recovery, with export volume of 345 million meters, up by 0.02%, and export value of USD 326 million, down by 9.79%. Exports to India kept growing, with export volume and value up by 33.10% and 18.40%, respectively. Beginning in 2012, the proportion of exports to ASEAN and India market increased year by year, while to Russian market declined year by year. (See Figure 10)
Forecast
It is expected that in the fourth quarter of 2016, the main business income, profit, export and other indicators of dyeing and printing enterprises will still maintain steady growth, and the annual production of dyeing and printing cloth is expected to achieve growth.
