Monthly Cotton Economic Letter (2017.02)
Mar 01, 2017 | by
Recent price movement
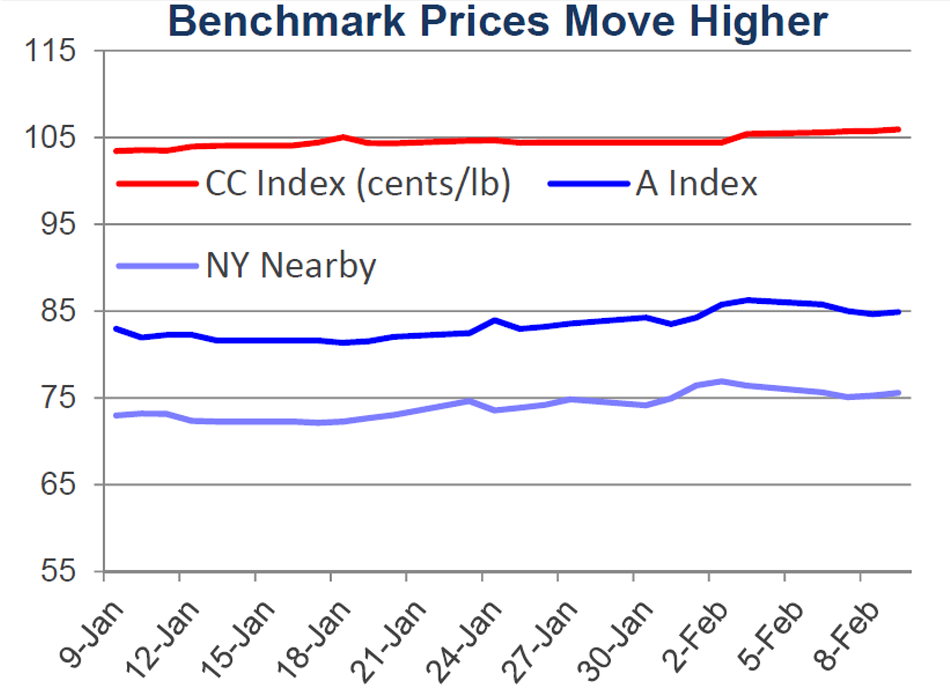
Cotton prices moved higher in early February, with values for NY futures, the A Index, and Pakistani spot prices all climbing to their highest levels since August. Indian prices rose, but remain well-below values from the summer and early fall. Current values for the CC Index are near the highs posted in early December.
l Prices for the March NY futures contract rose from values between 72 and 73 cents/lb in early January to a level slightly above 77 cents/lb in intraday trading in early February. In later trading, prices for March futures have retreated to levels near 75 cents/lb. Values for more distant contracts climbed higher than those for the nearby March contract. July futures set new life-of-contract highs in early February and remain above 77 cents/lb.
l Movement in the A Index followed that of NY futures. The A Index increased from values near 82 cents a month ago to levels over 86 cents/lb early this month. The most recent values have been near 85 cents/lb.
l Mill-delivered prices for Chinese cotton (CC Index) increased, but the change was smaller than it was for NY futures and the A Index. In international terms, the CC Index rose from 103 to 106 cents/lb. In domestic terms, the CC Index increased from 15,800 to 16,000 RMB/ton.
l Over the past months, prices for the Indian Shankar-6 variety increased from the equivalent of 77 to 80 cents/lb. In domestic terms, prices rose from 41,000 INR/candy to 42,000 INR/candy.
l Prices on the Pakistani spot market increased from 74 to 78 cents/lb. In domestic terms, the change was from 6,350 to 6,700 PRK/maund.
Supply, demand, & trade
This month's USDA report featured a slight increase in the forecast for world mill-use and little change to the world production estimate.
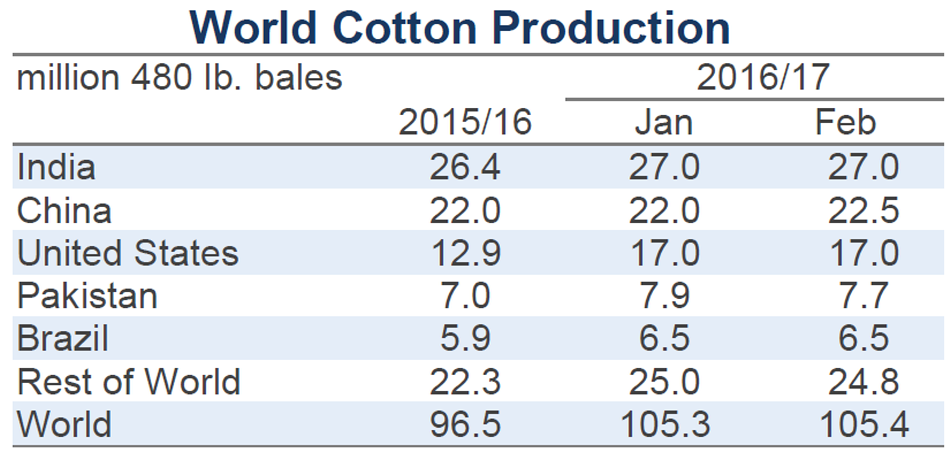
The latest projection for the 2016/17 global cotton harvest is 105.4 million bales, this is 83,000 bales higher than the estimate from last month. At the country-level, the largest revisions were for China (+500,000, from 22.0 to 22.5 million), Pakistan, (-200,000, from 7.9 to 7.7 million bales), Uzbekistan (-150,000, from 3.7 to 3.6 million), and Turkmenistan (-100,000, from 1.4 to 1.3 million).
The current forecast for world mill-use is 112.5 million, which is 762,000 bales higher than the estimate from last month. Driving the revision to the global figure were increases for India (+500,000, from 23.3 to 23.8 million), Bangladesh (+200,000, from 6.5 to 6.7 million), and Vietnam (+200,000, from 4.9 to 5.1 million). Subtracting from these gains were a number of small downward revisions across a range of countries.
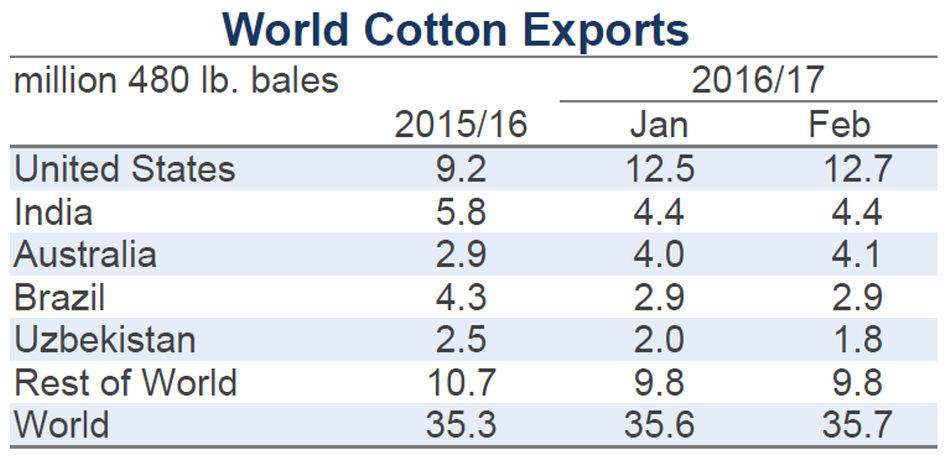
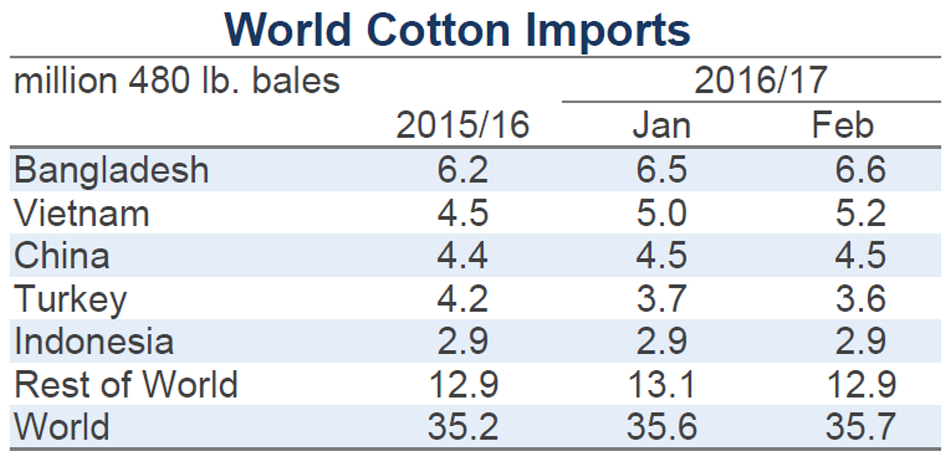
At the world-level, trade estimates changed only slightly (+100,000, from 35.6 to 35.7 million bales). Notable updates to import figures included those for Vietnam (+200,000, from 5.0 to 5.2 million bales), Bangladesh (+150,000, from 6.5 to 6.6 million), Pakistan (+100,000, from 2.6 to 2.7 million), South Korea (-100,000, from 1.2 to 1.1 million), and Turkey (-100,000, from 3.7 to 3.6 million). The largest changes to export estimates included those for the U.S. (+200,000, from 12.5 to 12.7 million bales), Australia (+100,000, from 4.0 to 4.1 million) and Uzbekistan (-200,000, from 2.0 to 1.8 million).
With the projection for world mill-use rising and the estimate for world production stable, there was a reduction to the forecast for world ending stocks (-747,000, from 90.6 to 89.9 million bales). For China, the production estimate increased while the figure for mill-use was stable. Correspondingly, the forecast for Chinese ending stocks rose half a million bales (from 48.3 to 48.8 million). Together, the decrease in global ending stocks and the increase in Chinese ending stocks implied a 1.2 million decrease to estimated ending stocks outside of China (from 42.3 to 41.1 million bales).
Estimated mill-use outside China was revised higher (+800,000, from 75.5 to 76.3 million bales) and expectations of less stocks and more consumption lowered the stocks-to-use ratio for the world-less-China by more than two percentage points (from 52.9% to 50.8%). The current value for the stocks-to-use ratio outside China is a little above the halfway point between the level for 2014/15 (52.3%) and 2015/16 (47.9%). In 2014/15, the A Index averaged 71 cents/lb and in 2015/16 the A Index averaged 70 cents/lb. Thus far into the 2016/17 crop year, the A Index has averaged 79 cents/lb and the latest values have been near 85 cents/lb..
Price outlook
With supply and demand estimates indicating more cotton is available in 2016/17 than there was in 2015/16, a question is why prices are higher. One factor has been the monetary reforms in India that have slowed the flow of cotton from the farm to international cotton merchants. The full weight of the Indian harvest may be eventually felt on prices, but its delayed appearance has inhibited it from pushing on prices and has likely been a factor supporting sales from other markets, like the U.S.
U.S. export sales have been strong, and the way that many U.S. export sales have been arranged is another factor supporting prices. Specifically, the near record volume (data from the Commodity Futures Trading Commission or CFTC, latest value ranks second only to one posted in November 2010) of unfixed on-call sales may have helped push prices higher. Discussion can become somewhat technical, but relative to price direction the most important detail associated with unfixed on-call sales is that they represent short hedging positions held by merchants. Once these contracts are “fixed”, these hedging positions are exited by merchants buying futures. Since there are so many unfixed on-call sales, there will have to be a lot of buying at some point, and that buying activity can push prices higher. These relationships are known by speculators, and the potential for price increases has likely motivated speculators to build and maintain their largest net long position in NY futures on record (CFTC data for futures and options back to 2006, record or near record net long position held since late November).
The National Cotton Council (NCC) will be releasing results from their survey of U.S. cotton producers’ planting intentions February 11th and the USDA will be releasing a preliminary set of supply and demand forecasts February 24th.