
High Prices in 2016/17 Encourages Cotton Area Expansion in 2017/18
May 27, 2017 | by
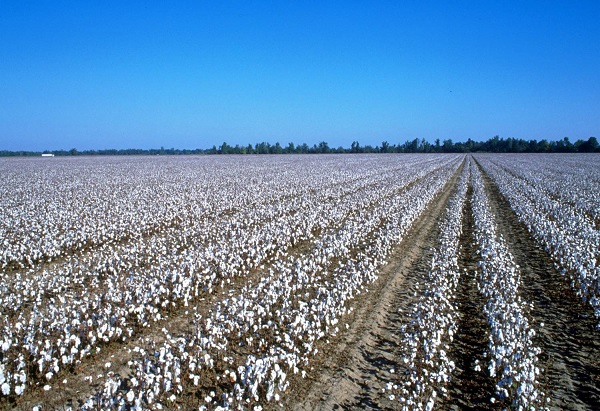
High cotton prices have prevailed in 2016/17, which are expected to encourage farmers to expand the area under cotton by 5% to 30.8 million hectares in 2017/18. India’s cotton area is forecast to increase by 7% to 11.3 million hectares in 2017/18 as farmers are encouraged by better returns due to high cotton prices and improved yields in 2016/17. Assuming yield is similar to the five-year average, production could increase by 3% to just under six million tons. After contracting in the last five seasons, China’s cotton area may expand by 3% to 2.9 million hectares due to the stable cotton policy and high cotton prices. Production in China is expected to rise by 1% to 4.8 million tons, the first increase in five seasons. Farmers in the United States are forecast to expand harvested cotton area by 12% to 4.3 million hectares, and assuming a yield of 938 kg/ha, production could grow by 8% to 4 million tons. Unlike the other top cotton producers, area in Uzbekistan is expected to contract by 4% to 1.2 million hectares in accordance with government plans to reduce areas where yields are low, and use them for other agricultural products. However, plentiful soil moisture may improve the average yield by 1% to 638 kg/ha, which will limit the loss in output. Uzbekistan’s cotton production is projected to decline by 2% to 770,000 tons. Anticipating falling cotton prices in early 2017/18, cotton area expansion may be more limited for producing countries in the Southern Hemisphere. Cotton area in Brazil and Australia is forecast to increase by 2% to 950,000 hectares and 3% to 574,000 hectares, respectively. Production in Brazil is projected to reach 1.4 million tons while Australia’s production is forecast to rise by 4% to 1 million tons.
World cotton mill use is expected to surpass world production for the third consecutive season in 2017/18. World consumption is projected to increase by 2% to 24.6 million tons as world economic growth recovers in 2017 and 2018. Mill use in China is forecast to increase by 1% to 7.7 million tons, accounting for 30% of world cotton consumption. After decreasing by 3% to 5.1 million tons in 2016/17, India’s consumption is forecast to recover by 2% to 5.2 million tons due to competitive prices for its cotton yarn products, expanding capacity and the resolution of the consequences of demonetization. Mill use in Pakistan may grow by 1% to 2.3 million tons due to new incentives for textile exports offered by the government. Bangladesh’s cotton consumption is projected to expand by 5% to 1.5 million tons, making it the fourth largest in 2017/18.
World cotton trade is projected up by 5% to 7.9 million tons in 2016/17, after declines during the previous three seasons. Imports by Bangladesh are forecast to rise by 3% to 1.4 million tons in 2016/17, while imports by Vietnam should increase by 16% to 1.2 million tons. Imports by China, now the world’s third largest cotton importer, are expected to increase by 3% to 987,000 tons. Exports from the United States are projected to increase by 53% to 3 million tons and are likely to account for 38% of world exports in 2016/17. India’s exports are projected to decrease by 30% to 886,000 tons.
Sales from China’s reserve in April 2017 reached 404,000 tons, which is slightly lower than the total volume sold in March 2017 of 466,000 tons. At the end of 2016/17, China’s total stocks are projected to have fallen by 17% to 9.3 million tons. World ending stocks in 2016/17, are expected to decline by 7% to 17.4 million tons, and in 2017/18, by 5% to 16.4 million tons.
| WORLD COTTON SUPPLY AND DISTRIBUTION | |||||||
| 2015/16 | 2016/17 | 2017/18 | 2015/16 | 2016/17 | 2017/18 | ||
| Changes from previous month | |||||||
| Million Tons | Million Tons | ||||||
| Production | 21.06 | 22.76 | 23.58 | 0.02 | -0.03 | 0.46 | |
| Consumption | 24.15 | 24.11 | 24.55 | 0.02 | 0.01 | 0.13 | |
| Imports | 7.54 | 7.95 | 8.09 | 0.00 | 0.10 | 0.03 | |
| Exports | 7.59 | 7.95 | 8.09 | 0.00 | 0.10 | 0.03 | |
| Ending Stocks | 18.74 | 17.37 | 16.41 | -0.44 | -0.48 | -0.14 | |
| Cotlook A Index* | 70 | 79 | 71 | ||||
*The price projection for 2016/17 is based on the ending stocks/consumption ratio in the world-less-China in 2014/15 (estimate), 2015/16 (estimate) and in 2016/17 (projection); on the ratio of Chinese net imports to world imports in 2015/16 (estimate) and 2016/17 (projection). The price projection is the mid-point of the 95% confidence interval: 75 cts/lb to 83 cts/lb.
*The price projection for 2016/17 is based on the ending stocks to mill use ratio in the world-less-China in 2015/16 (estimate), 2016/17 (projection) and 2017/18 (projection); on the ratio of Chinese net imports to world imports in 2016/17 (projection) and 2017/18 (projection); and on the price projection of 2016/17. The price projection is the mid-point of the 95% confidence interval: 51 cts/lb to 80 cts/lb.
(Source: ICAC)
ALL COMMENTS